Search Results
Showing results 1 to 6 of 6
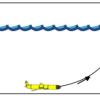
Exploring the Ocean with Robots
Source Institutions
In this activity, learners are introduced to robotic submarines called gliders. Learners make “gliders” from plastic syringes and compare these to Cartesian bottles and plastic bubbles.
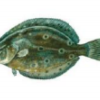
Ocean Home: Swimming Fishes
Source Institutions
In this activity, learners model, on a human-sized board game, how changes in water temperature may affect fish distributions and, ultimately, fisheries.
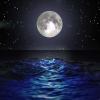
The Ins and Outs of Tides: Learn About Causes and Predictions
Source Institutions
In this activity, learners will compare predicted and observed tides using data from The National Oceanic and Atmospheric Administration(NOAA).
Heat Capacity: Can't Take the Heat?
Source Institutions
Why is ocean water sometimes the warmest when the average daily air temperature starts to drop? In this activity, learners explore the differing heat capacities of water and air using real data.
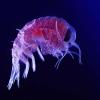
Amphipods: More than Mud
Source Institutions
In this data analysis and environmental science activity, learners examine the effects of pollution on amphipods using data from the Chesapeake Ecotox Research Program.
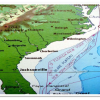
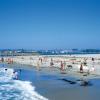
A Hurricane's Storm Surge Affects our Estuaries
Source Institutions
In this activity, learners construct a coastal landmass from sand and add features such as tidal creeks and barrier islands.