Search Results
Showing results 1 to 7 of 7
Starburst® Graph
Source Institutions
In this activity, learners use Starburst® candy to sort, classify, compare, and graph. Learners grab a handful of one-inch candy squares, sort them by color, graph the candy, and discuss the results.
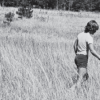
Animals in a Grassland
Source Institutions
In this outdoor, warm weather activity, learners use sweepnets to search a grassy area such as a large lawn or field, collecting small animals to find as many different kinds of animals as possible.
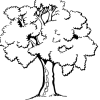
Tree Tally
Source Institutions
In this outdoor activity and fun race, learners first find the most common type of tree in a forest site.
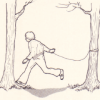
Balance Challenge
Source Institutions
In this quick activity, learners take a balance challenge to measure their average balance time. As they collect data, they investigate how practice and repetition improve their balance time.
Tree-mendous Plots
Source Institutions
In this math lesson, learners record and graph plant growth and interpret data. Learners plant seeds, and once the seeds sprout, record the change in height of the plants for several days.
Scientific Measurement Exercise
Source Institutions
Learners measure irregularly shaped bones using a variety of measurement methods and tools. Then, they measure again using standard conventions and metric tape measures.
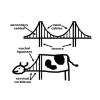
Fruity-Glows: Pictures of Health on a Microarray Canvas
Source Institutions
In this activity (page 12), learners apply the concepts of pixilation and pointillism to the world of biomedical science.