Search Results
Showing results 1 to 8 of 8
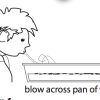
Blowin’ Up a Storm of Oil
Source Institutions
In this activity, learners investigate how wind can create surface currents and how waves move. Learners also discover how wind can affect oil spills.
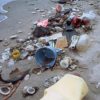
Trash Traits
Source Institutions
In this activity on page 24, learners perform experiments to examine whether or not trash can float, blow around, or wash away.
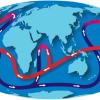
The Return of El Nino
Source Institutions
In this activity related to climate change and data analysis, learners examine temperature and precipitation data to determine if climate variations are due to El Niño.
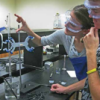
That Sinking Feeling
Source Institutions
In this quick activity, learners observe how salinity and temperature affect the density of water, to better understand the Great Ocean Conveyor.
Corals on Acid
Source Institutions
The objective of this inquiry-based lesson is for learners to gain an understanding of how increasing ocean acidity can affect the calcification of marine organisms.
Portable Potable Pressure
Source Institutions
In this activity, learners use plastic water bottles, wood, and water to build an inexpensive and portable tool to demonstrate one atmosphere of pressure at sea level.
What-a-cycle
Source Institutions
In this activity, learners act as water molecules and travel through parts of the water cycle to discover that it is more complex than just water moving from the ground to the atmosphere.
Heat Capacity: Can't Take the Heat?
Source Institutions
Why is ocean water sometimes the warmest when the average daily air temperature starts to drop? In this activity, learners explore the differing heat capacities of water and air using real data.