Search Results
Showing results 1 to 17 of 17
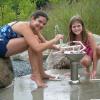
Investigating Density Currents
Source Institutions
In this lab activity, learners explore how to initiate a density current. Learners measure six flasks with different concentrations of salt and water (colored blue).
Measure the Speed of a Water Leak
Source Institutions
In this activity (page 2 of PDF under GPS: Glaciers Activity), learners will measure the rate at which water streams out of a leaky cup.
A Cubic Foot Per Second
Source Institutions
In this activity, learners measure and calculate the amount of cubic feet various containers contain. Next, learners investigate cubic feet per second (cps), by carrying jugs in one second.
How Big is Small
Source Institutions
In this classic hands-on activity, learners estimate the length of a molecule by floating a fatty acid (oleic acid) on water.

Float My Boat
Source Institutions
In this activity, learners use tinfoil to build and test their own boats - which designs will float, and which will sink?
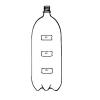
Under Pressure
Source Institutions
In this experiment, learners examine how pressure affects water flow. In small groups, learners work with water and a soda bottle, and then relate their findings to pressure in the deep ocean.
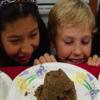
Aesop's Arithmetic
Source Institutions
In this activity (located on page 9 of the PDF), learners are introduced to Aesop's fable, "The Crow and the Pitcher." In the story, a clever crow drops pebbles into a pitcher to cause the water level
Boats Afloat
Source Institutions
In this water activity, learners build boats that float and sink. First, learners listen to the book, "Who Sank the Boat" and practice making predictions throughout the story.
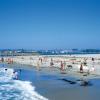
Shower Estimation
Source Institutions
In this activity, learners calculate their water usage (in cups and galloons) during an average shower. Learners also chart and analyze water usage during showers in their households.
OBIS Oil Spill
Source Institutions
In this outdoor activity, learners simulate an oil spill using popcorn (both oil and popcorn float on water), and estimate the spill's impact on the environment.
Making Rivers
Source Institutions
In this outdoor water activity, learners explore how to change the direction of water flow. Learners make puddles in dirt or use existing puddles and sticks to make water flow.
Great Steamboat Race
Source Institutions
In this outdoor activity, learners race small boats, made of cork, balsa wood, popsicle sticks etc., to investigate the rate and direction of currents in a stream or creek.
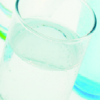
Build A Hydrometer
Source Institutions
In this activity, learners will explore how a hydrometer works by building a working model and conducting experiments.
Water: A Basic Ingredient
Source Institutions
In this activity, learners explore healthy choices related to the liquids they drink. The importance of water and milk as essential nutrients for a healthy body is the focus of the experience.
Sand Castle Saturation
Source Institutions
In this activity about saturation (page 1 of PDF under SciGirls Activity: Sand Dunes), learners will build a series of sand castle towers using a 16 oz cup.
Heat Capacity: Can't Take the Heat?
Source Institutions
Why is ocean water sometimes the warmest when the average daily air temperature starts to drop? In this activity, learners explore the differing heat capacities of water and air using real data.
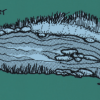
Mystery of the Disappearing Cottonwoods
Source Institutions
Learners will explore the scientific mystery behind a disappearing group of trees by examining data and attempting to explain the decline.