Search Results
Showing results 1 to 11 of 11
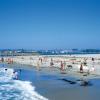
Heat Capacity: Can't Take the Heat?
Source Institutions
Why is ocean water sometimes the warmest when the average daily air temperature starts to drop? In this activity, learners explore the differing heat capacities of water and air using real data.

Determining the Amount of Transpiration from a Schoolyard Tree
Source Institutions
In this activity, learners calculate the number of milliliters of water a nearby tree transpires per day.

Drops on a Penny
Source Institutions
In this activity, challenge learners to predict and investigate how many water drops they can fit on one penny.

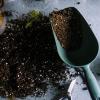
Super Soaking Materials
Source Institutions
In this activity, learners will test cups full of potting soil, sand, and sphagnum moss to see which earth material is able to soak up the most water.
Super Soaker
Source Institutions
In this activity (page 1 of the PDF under SciGirls Activity: Bogs), learners will test cups full of potting soil, sand, and sphagnum moss to see which earth material is able to soak up the most water.
The Ballistic Pendulum
Source Institutions
In this physics crime lab or demonstration, learners pretend they are criminologists and must find the "muzzle velocity" (speed of the bullet as it leaves the gun) of a gun used to commit a crime.
How Big is Small
Source Institutions
In this classic hands-on activity, learners estimate the length of a molecule by floating a fatty acid (oleic acid) on water.
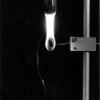
Burn a Peanut
Source Institutions
In this activity, learners burn a peanut, which produces a flame that can be used to boil away water and count the calories contained in the peanut.

Mass of the Earth
Source Institutions
In this activity, learners use basic measurements of the Earth and pieces of rock and iron to estimate the mass of the Earth.
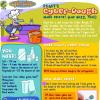
Digit's Cyber-Dough
Source Institutions
In this fun hands-on activity, learners whip up a batch of cyber-dough (play dough) using math for measurements.
Arctic Sea Ice
Source Institutions
In this activity, learners explore how the area of Arctic sea ice has changed over recent years. First, learners graph the area of Arctic sea ice over time from 1979 to 2007.