Search Results
Showing results 161 to 177 of 177
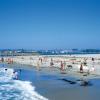
Heat Capacity: Can't Take the Heat?
Source Institutions
Why is ocean water sometimes the warmest when the average daily air temperature starts to drop? In this activity, learners explore the differing heat capacities of water and air using real data.
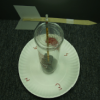
Design and Build a Wind Vane
Source Institutions
In this activity, learners design and build a simple wind vane —one of the oldest kinds of weather tools— and use it to show wind direction.
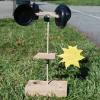
Weather Vane and Anemometer
Source Institutions
In this meteorology activity, learners construct simple devices to measure the direction and speed of wind.
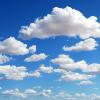
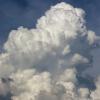
What is a "Model"?
Source Institutions
In this activity, learners simulate the behavior of the atmosphere.
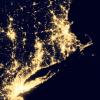
Where Do We Choose to Live and Why?
Source Institutions
In this geography investigation, learners use a nighttime satellite image to observe areas of light across the United States and to identify patterns and spatial distributions of human settlements.
Global Climate Change and Sea Level Rise
Source Institutions
In this activity, learners practice the steps involved in a scientific investigation while learning why ice formations on land (not those on water) will cause a rise in sea level upon melting.
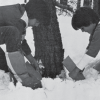
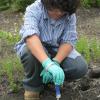
Wintergreen
Source Institutions
In this outdoor, winter activity, learners find living green plants under the snow and determine the light and temperature conditions around the plants.
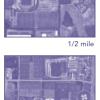
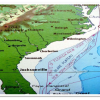
Aerial Imagery
Source Institutions
This activity (on page 2 of the PDF under SciGirls Activity: Earthquakes) is a full inquiry investigation into aerial imagery.
Discovering Rainforest Locations
Source Institutions
In this activity, learners will examine various world data maps to combine the information and predict which areas could be tropical rainforests.
Ocean Currents
Source Institutions
In this activity, learners will explore how density is affected by temperature and how that can create currents.
The Crayon Rock Cycle
Source Institutions
In this activity, learners use crayons to draw conclusions about rocks and the rock cycle.
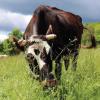
Sustainable Grazing
Source Institutions
In this activity, learners investigate the food, water, and space needs of common livestock animals.
Make Your Own Weather Station
Source Institutions
This three-part activity shows learners how to build three meteorology tools: a wind vane, a rain gauge, and a barometer.
A Hurricane's Storm Surge Affects our Estuaries
Source Institutions
In this activity, learners construct a coastal landmass from sand and add features such as tidal creeks and barrier islands.
Model Well
Source Institutions
In this quick activity about pollutants and groundwater (page 2 of PDF under Water Clean-up Activity), learners build a model well with a toilet paper tube.
Convection
Source Institutions
In this activity, learners model atmospheric convection currents using food coloring, water, and clear cups. Activity includes step-by-step instructions, STEM connections, and more.
Solar Flip Book
Source Institutions
In this activity, learners make a flip book that shows the progression of two solar events on reversible sides of the flip book.