Search Results
Showing results 21 to 40 of 40
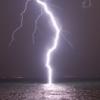
Haunted by Hurricanes: Use Data to Learn About Hurricanes
Source Institutions
In this activity, learners will determine if the frequency and intensity of hurricanes are changing using real data from the National Hurricane Center.
The Return of El Nino
Source Institutions
In this activity related to climate change and data analysis, learners examine temperature and precipitation data to determine if climate variations are due to El Niño.
Conductivity: Salty Water
Source Institutions
Water, whether fresh or salty, serves as one of the best electrical conductors on the planet. Does salt effect its conductivity?
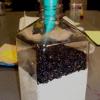
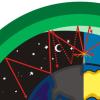
Earth Atmosphere Composition
Source Institutions
In this activity, learners use rice grains to model the composition of the atmosphere of the Earth today and in 1880. Learners assemble the model while measuring percentages.
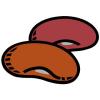
Not Just A Bag Of Beans
Source Institutions
In this activity, learners count and measure kidney beans to explore natural selection and variation. Learners measure the length of 50-100 beans.
The Blue Crab's Chesapeake Journey
Source Institutions
In this data collection activity about crabs, learners use data from the Virginia Institute of Marine Science (VIMS) trawl survey to determine the areas of the Chesapeake Bay that are being used by bl
Tsunami: Waves of Destruction
Source Institutions
In this activity, learners use tsunami time travel maps to predict how long it will take a tsunami to reach the shore.
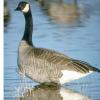
Canada Goose: Explore Trends With Data
Source Institutions
In this activity, learners will explore trends in Canada goose populations using real data from the National Audubon Society's Christmas Bird Count.
Survival of the Fittest: Battling Beetles
Source Institutions
This guided inquiry three-part activity engages learners in thinking about the mechanism of natural selection through data collection and pattern recognition.
Water Walk
Source Institutions
Learners take a field trip along a local body of water and conduct a visual survey to discover information about local land use and water quality.
Harmful Algal Blooms: In Full Bloom
Source Institutions
In this activity, learners will investigate the impacts of harmful phytoplankton using NOAA's Coastal Services Center Harmful Algal Bloom Forecasting (HABF) Project data.
Waves: An Alternative Energy Source
Source Institutions
In this data analysis and environmental science activity, learners evaluate the feasibility of wave energy as a practical alternative energy source using ocean observing system (OOS) buoys.
AM in the PM
Source Institutions
In this activity, learners will listen to as many radio stations as possible to discover that AM radio signals can travel many hundreds of miles at night.
The Beaks of the Finches
Source Institutions
In this simulation, learners become birds different beak types. Learners use various tools to represent beaks to pick up seeds and place them in a petri dish.
Trail Impact Study
Source Institutions
In this outdoor activity, learners plan a simple foot path and create an environmental impact study of the natural area where the path would be.
Give or Take?
Source Institutions
In this outdoor activity, learners work in pairs using their senses—especially touch—to learn more about individual trees.
Trail Construction
Source Institutions
In this highly physical outdoor activity, learners construct and compare experimental trail sections to select the best trail-construction technique for their site.
Off Base
Source Institutions
In this activity, learners explore the factors that tend to resist changes in pH of the ocean and why the ocean is becoming more acidic.
The Dead Zone: A Marine Horror Story
Source Institutions
In this environmental science and data analysis activity, learners work in groups to track a Dead Zone (decreased dissolved oxygen content of a body of water) using water quality data from the Nutrien
Without An Ark: The Effects of Storms and Floods
Source Institutions
April showers bring May flowers, but what do coastal storms bring?