Search Results
Showing results 41 to 60 of 71
Fish Eyes: More than Meets the Eye
Source Institutions
In this data collection and analysis activity, learners evaluate fish physiology and ecology using vision research data from Dr.
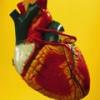
Heart of the Matter
Source Institutions
In this activity, learners explore the concept of valve operation and how engineers have adapted valves for use in mechanical heart valve design.
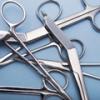
Smooth Operator
Source Institutions
In this activity, learners explore surgical instrument design. Teams of learners construct surgical instruments from everyday materials.
Oil Spill Solutions
Source Institutions
In this activity, learners explore how environmental engineers might approach solving the problem of an oil spill.
Our Sense of Sight: How We Perceive Movement, Depth and Illusions
Source Institutions
In this activity, learners investigate visual perception as well as plan and conduct their own experiments.
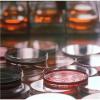
On the Microbe Trail: An Introduction to Bacteria and Aseptic Technique
Source Institutions
In this series of exercises, learners predict the conditions necessary for bacterial growth, test their predictions and at the same time practice the aseptic techniques and safety procedures needed wh
Hazardous Chemicals in Your Neighborhood
Source Institutions
In this environmental science lesson, learners will examine hazardous chemicals and their effects on human health and the environment.
The Return of El Nino
Source Institutions
In this activity related to climate change and data analysis, learners examine temperature and precipitation data to determine if climate variations are due to El Niño.
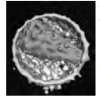
Modeling an HIV Particle
Source Institutions
This activity helps learners visualize the Human Immunodeficiency Virus (HIV) by constructing three-dimensional HIV particle models from paper.
Gene Switches
Source Institutions
In this activity, learners explore how genetic switches function and the role of genetic switches in the process of evolution.
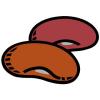
Not Just A Bag Of Beans
Source Institutions
In this activity, learners count and measure kidney beans to explore natural selection and variation. Learners measure the length of 50-100 beans.
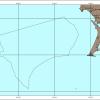
West Coast Shipwrecks
Source Institutions
In this data activity, learners will explore shipwrecks from four National Marine Sanctuaries on the West Coast of the United States.
The Blue Crab's Chesapeake Journey
Source Institutions
In this data collection activity about crabs, learners use data from the Virginia Institute of Marine Science (VIMS) trawl survey to determine the areas of the Chesapeake Bay that are being used by bl
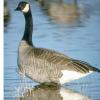
Canada Goose: Explore Trends With Data
Source Institutions
In this activity, learners will explore trends in Canada goose populations using real data from the National Audubon Society's Christmas Bird Count.
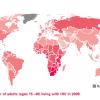
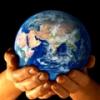
Mapping the Spread of HIV/AIDS: Trailing the Pandemic
Source Institutions
In this activity, learners act as epidemiologists by mapping the prevalence of HIV/AIDS worldwide.
Survival of the Fittest: Battling Beetles
Source Institutions
This guided inquiry three-part activity engages learners in thinking about the mechanism of natural selection through data collection and pattern recognition.
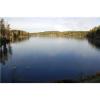
Water Walk
Source Institutions
Learners take a field trip along a local body of water and conduct a visual survey to discover information about local land use and water quality.
Harmful Algal Blooms: In Full Bloom
Source Institutions
In this activity, learners will investigate the impacts of harmful phytoplankton using NOAA's Coastal Services Center Harmful Algal Bloom Forecasting (HABF) Project data.
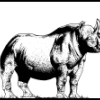
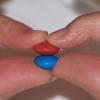
Exponential Models: Rhinos and M&M’s ®
Source Institutions
In this math lesson, learners model exponential decay and exponential growth using M&M's, paper folding, and African rhino population data.
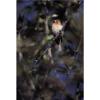
The Beaks of the Finches
Source Institutions
In this simulation, learners become birds different beak types. Learners use various tools to represent beaks to pick up seeds and place them in a petri dish.