Search Results
Showing results 61 to 80 of 92
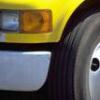
How the Rubber Meets the Road
Source Institutions
In this activity, learners explore how engineers design tire treads to increase safety and reliability.
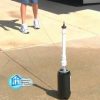
Detect Solar Storms
Source Institutions
In this activity, learners build their own magnetometer using an empty soda bottle, magnets, laser pointer, and household objects.
The Blue Crab's Chesapeake Journey
Source Institutions
In this data collection activity about crabs, learners use data from the Virginia Institute of Marine Science (VIMS) trawl survey to determine the areas of the Chesapeake Bay that are being used by bl
Tsunami: Waves of Destruction
Source Institutions
In this activity, learners use tsunami time travel maps to predict how long it will take a tsunami to reach the shore.

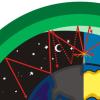
Telescopes as Time Machines
Source Institutions
This fun, nighttime hands-on astronomy activity lets learners explore how long it takes for light from different objects in the universe to reach Earth.
Sizing Up Temperature
Source Institutions
In this activity, learners explore Charles' Law in a syringe.
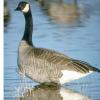
Canada Goose: Explore Trends With Data
Source Institutions
In this activity, learners will explore trends in Canada goose populations using real data from the National Audubon Society's Christmas Bird Count.
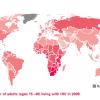
Mapping the Spread of HIV/AIDS: Trailing the Pandemic
Source Institutions
In this activity, learners act as epidemiologists by mapping the prevalence of HIV/AIDS worldwide.
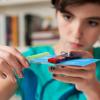
Number of Mentos vs. Height: Soda Geyser Series #5
Source Institutions
In this activity, learners conduct a controlled experiment to examine how many Mentos are needed to make the tallest possible soda geyser.
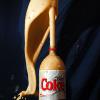
Soda Brand vs. Height Experiment: Soda Geyser Series #4
Source Institutions
In this activity, learners conduct a controlled experiment to examine which brand of soda makes the best (highest) soda geyser.
Survival of the Fittest: Battling Beetles
Source Institutions
This guided inquiry three-part activity engages learners in thinking about the mechanism of natural selection through data collection and pattern recognition.
Water Walk
Source Institutions
Learners take a field trip along a local body of water and conduct a visual survey to discover information about local land use and water quality.
Harmful Algal Blooms: In Full Bloom
Source Institutions
In this activity, learners will investigate the impacts of harmful phytoplankton using NOAA's Coastal Services Center Harmful Algal Bloom Forecasting (HABF) Project data.
Paper Tape Motion Timer
Source Institutions
In this activity, learners build a recording timer made from simple materials (e.g., small dc motor, sharpie pen, craft sticks, adding machine paper tape, etc.).
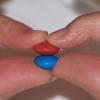
Exponential Models: Rhinos and M&M’s ®
Source Institutions
In this math lesson, learners model exponential decay and exponential growth using M&M's, paper folding, and African rhino population data.
Dye Like A Natural
Source Institutions
In this activity, learners stain fabrics--on purpose!
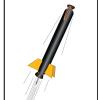
Foam Rocket
Source Institutions
In this activity, learners work in teams build and launch rubberband-powered foam rockets.
Waves: An Alternative Energy Source
Source Institutions
In this data analysis and environmental science activity, learners evaluate the feasibility of wave energy as a practical alternative energy source using ocean observing system (OOS) buoys.
AM in the PM
Source Institutions
In this activity, learners will listen to as many radio stations as possible to discover that AM radio signals can travel many hundreds of miles at night.
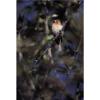
The Beaks of the Finches
Source Institutions
In this simulation, learners become birds different beak types. Learners use various tools to represent beaks to pick up seeds and place them in a petri dish.