Search Results
Showing results 21 to 40 of 172
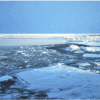
Arctic Sea Ice
Source Institutions
In this activity, learners explore how the area of Arctic sea ice has changed over recent years. First, learners graph the area of Arctic sea ice over time from 1979 to 2007.
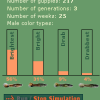
Flashy Fish
Source Institutions
Professor John Endler traveled to Trinidad in the 1970s to study wild guppies. In this activity, learners take part in an online simulation of Endler's work.
Let's Count Humpback Whales: Environmental Effects on Population
Source Institutions
In this activity, learners use whale count data from the Hawaiian Islands Humpback Whale National Marine Sanctuary to compare whale counts in relation to environmental factors.
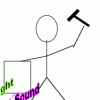
Lagging Sound
Source Institutions
In this group activity, learners see and hear the speed of sound. A learner designated the "gonger" hits a gong, once every second, as the rest of the group watches and listens from a distance.
Feeling Pressured
Source Institutions
In this activity, learners (at least three) work together to explore the effects of atmospheric pressure.
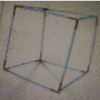
Ambiguous Cube
Source Institutions
In this activity, learners construct a three-dimensional ambiguous cube to explore visual illusions and how our brains interpret or misinterpret information.
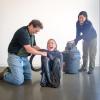
Handwashing Laboratory Activities: Bowl Technique
Source Institutions
In this lab (Activity #2 on page), learners compare bacteria growth on two petri dishes containing nutrient agar. Learners touch the doors, faucets, etc.
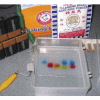
Gel Electrophoresis
Source Institutions
In this activity, learners simulate the process of DNA fingerprinting by using electricity to separate colored dyes.
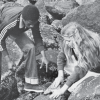
Rock Pioneers
Source Institutions
In this outdoor activity/field trip, learners investigate organisms that live along the ocean's rocky coast.
Dark Adaptation
Source Institutions
In this activity (6th on the page), learners investigate how photoreceptors in the eye (rods and cones) "adapt" to low light conditions.
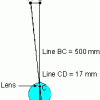
Measuring Your Blind Spot
Source Institutions
In this activity, learners calculate the width (horizontal diameter) of the blind spot on their retina. Learners make a blind spot tester using a piece of notebook paper.
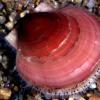
The Scoop on Scallops
Source Institutions
In this data analysis activity, learners quantify the abundance and distribution of sea scallops in and adjacent to the Mid-Atlantic closed areas.
Crunch Time
Source Institutions
In this quick and easy activity and/or demonstration, learners use two empty 2-liter bottles and hot tap water to illustrate the effect of heat on pressure.
Sea State: Forecast Conditions at Sea
Source Institutions
In this oceanography and data collection activity, learners cast real time sea state conditions using buoys from NOAA's National Data Buoy Center.
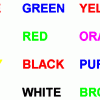
Colors, Colors?
Source Institutions
In this activity related to the famous "Stroop Effect," learners explore how words influence what we see and how the brain handles "mixed messages." Learners read colored words and are asked to say th
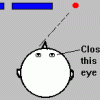
The Blind Spot
Source Institutions
In this activity (1st on the page), learners find their blind spot--the area on the retina without receptors that respond to light.
Do Cities Affect the Weather?
Source Institutions
In this activity, learners explore clouds and how they form.
Vanishing Rods
Source Institutions
This is a quick activity/demonstration that introduces learners to the concept of index of refraction. Learners place stirring rods in a jar of water and notice they can see them clearly.
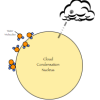
How can Clouds Help Keep the Air Warmer?
Source Institutions
In this activity, learners explore how air warms when it condenses water vapor or makes clouds.
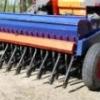
Planting with Precision
Source Institutions
In this activity, learners explore how engineers work to solve the challenges of a society, such as efficient planting and harvesting.