Search Results
Showing results 21 to 40 of 198
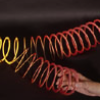
Seismic Slinky!
Source Institutions
Did you know that a Slinky makes a handy model of earthquake waves?
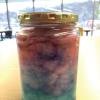
Nebula in a Jar
Source Institutions
In this activity, learners will build a model of a nebula using cotton balls and colored water. Astronomers photograph nebulas and add colors to provide information about the nebula's composition.
A Cubic Foot Per Second
Source Institutions
In this activity, learners measure and calculate the amount of cubic feet various containers contain. Next, learners investigate cubic feet per second (cps), by carrying jugs in one second.
Whose Fault Is It?
Source Institutions
In this seismic simulation, learners play a "who-dunnit" game to explore earthquakes.
Jem's Pykrete Challenge
Source Institutions
In this activity, learners make pykrete by freezing a mixture of water and a material like cotton wool, grass, hair, shredded paper, wood chips, or sawdust.
Arctic Sea Ice
Source Institutions
In this activity, learners explore how the area of Arctic sea ice has changed over recent years. First, learners graph the area of Arctic sea ice over time from 1979 to 2007.
Let's Count Humpback Whales: Environmental Effects on Population
Source Institutions
In this activity, learners use whale count data from the Hawaiian Islands Humpback Whale National Marine Sanctuary to compare whale counts in relation to environmental factors.
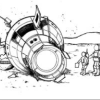
Crash Landing!
Source Institutions
In this activity, groups cut out and sort cards showing items recovered from a crash landing on the Moon. The 12 items range from food and water to rope and matches to a self-inflating life raft.
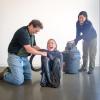
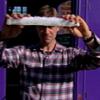
Feeling Pressured
Source Institutions
In this activity, learners (at least three) work together to explore the effects of atmospheric pressure.
Single Serving Volcanism
Source Institutions
In this activity, learners eat a snack and make a model of the plumbing system of a volcano.
How Big is Small
Source Institutions
In this classic hands-on activity, learners estimate the length of a molecule by floating a fatty acid (oleic acid) on water.
Running in Circles
Source Institutions
In this group activity, learners use some common objects and work together to simulate the Coriolis effect. During the challenge, learners make predictions and test different scenarios.
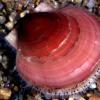
Shell Shifts
Source Institutions
Ocean acidification is a big issue due to the amount of carbon dioxide humans release. CO2 in the atmosphere is absorbed into the ocean thus changing its acidity.
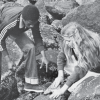
Rock Pioneers
Source Institutions
In this outdoor activity/field trip, learners investigate organisms that live along the ocean's rocky coast.
The Scoop on Scallops
Source Institutions
In this data analysis activity, learners quantify the abundance and distribution of sea scallops in and adjacent to the Mid-Atlantic closed areas.
Crunch Time
Source Institutions
In this quick and easy activity and/or demonstration, learners use two empty 2-liter bottles and hot tap water to illustrate the effect of heat on pressure.
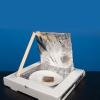
Cook Food Using the Sun
Source Institutions
Learners build a solar oven from a cardboard pizza box, aluminum foil and plastic. Learners can use their oven to cook S'mores or other food in the sun.
Sea State: Forecast Conditions at Sea
Source Institutions
In this oceanography and data collection activity, learners cast real time sea state conditions using buoys from NOAA's National Data Buoy Center.

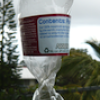
Percentage of Oxygen in the Air
Source Institutions
In this activity, learners calculate the percentage of oxygen in the atmosphere by using steel wool's ability to rust.
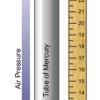
Measure the Pressure: The "Wet" Barometer
Source Institutions
In this activity, learners use simple items to construct a device for indicating air pressure changes.