Search Results
Showing results 321 to 340 of 530
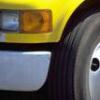
How the Rubber Meets the Road
Source Institutions
In this activity, learners explore how engineers design tire treads to increase safety and reliability.
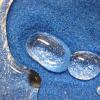
Magic Sand: Nanosurfaces
Source Institutions
This is an activity/demo in which learners are exposed to the difference bewteen hydrophobic surfaces (water repelling) and hydrophilic surfaces (water loving).
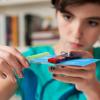
Carbon Configurations
Source Institutions
In this activity, learners use geometry to predict the shape of carbon. Learners twist and attach chenille stem pieces that represent bonds between different carbon atoms.
Detect Solar Storms
Source Institutions
In this activity, learners build their own magnetometer using an empty soda bottle, magnets, laser pointer, and household objects.
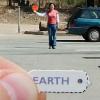
Scale Model of Sun and Earth
Source Institutions
In this activity, learners explore the relative size of the Sun and Earth as well as the distance between them.
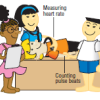
Changing Body Positions: How Does the Circulatory System Adjust?
Source Institutions
In this activity about how the body regulates blood pressure (page 117 of the PDF), learners make and compare measurements of heart rate and blood pressure from three body positions: sitting, standing
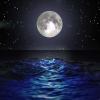
The Ins and Outs of Tides: Learn About Causes and Predictions
Source Institutions
In this activity, learners will compare predicted and observed tides using data from The National Oceanic and Atmospheric Administration(NOAA).
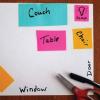
Make A Map for A Treasure Hunt
Source Institutions
In this activity, learners will explore how maps can provide information about a place and help us find our way from one location to another.
The Blue Crab's Chesapeake Journey
Source Institutions
In this data collection activity about crabs, learners use data from the Virginia Institute of Marine Science (VIMS) trawl survey to determine the areas of the Chesapeake Bay that are being used by bl
Making An Impact!
Source Institutions
In this activity (on page 14 of PDF), learners use a pan full of flour and some rocks to create a moonscape.
Tsunami: Waves of Destruction
Source Institutions
In this activity, learners use tsunami time travel maps to predict how long it will take a tsunami to reach the shore.
Mapping the Homunculus
Source Institutions
In this activity, learners will explore how the human brain interprets environmental stimuli.
There's Always Room For JELL-O
Source Institutions
In this activity, learners cut wells in JELL-O© and load the wells with different detergent solutions.
Using Different Models of Earth
Source Institutions
In this activity, learners explore how the shapes, sizes, and distances of land masses appear differently on two different models of Earth: an icosahedron and a flat map.
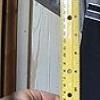
Slide Rules
Source Institutions
Learners make their own simple slide rules out of paper and learn how they work.
Auditory Acuity
Source Institutions
This activity (8th activity on the page) tests learners' ability to identify things using only the sense of hearing.
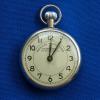
How Fast Are You?
Source Institutions
This activity is designed to let learners measure their reaction time or response time to something they see.
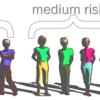
Risk Continuum
Source Institutions
This activity is a whole-group kinesthetic demonstration that shows learners what it means to be in a "risk group" for developing heart disease based on family history and genetics.

Telescopes as Time Machines
Source Institutions
This fun, nighttime hands-on astronomy activity lets learners explore how long it takes for light from different objects in the universe to reach Earth.
Sizing Up Temperature
Source Institutions
In this activity, learners explore Charles' Law in a syringe.