Search Results
Showing results 341 to 360 of 534
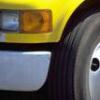
How the Rubber Meets the Road
Source Institutions
In this activity, learners explore how engineers design tire treads to increase safety and reliability.
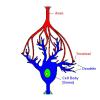
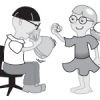
Neuron Chain Tag
Source Institutions
In this outdoor activity, learners play a game of Tag to discover how neurons attach themselves to each other to form a chain.
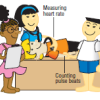
Changing Body Positions: How Does the Circulatory System Adjust?
Source Institutions
In this activity about how the body regulates blood pressure (page 117 of the PDF), learners make and compare measurements of heart rate and blood pressure from three body positions: sitting, standing
Regolith Formation
Source Institutions
In this three-part activity, learners use food to determine the effects of wind, sandblasting and water on regolith (dust) formation and deposition on Earth.
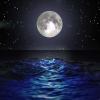
The Ins and Outs of Tides: Learn About Causes and Predictions
Source Institutions
In this activity, learners will compare predicted and observed tides using data from The National Oceanic and Atmospheric Administration(NOAA).
The Blue Crab's Chesapeake Journey
Source Institutions
In this data collection activity about crabs, learners use data from the Virginia Institute of Marine Science (VIMS) trawl survey to determine the areas of the Chesapeake Bay that are being used by bl
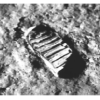
Making An Impact!
Source Institutions
In this activity (on page 14 of PDF), learners use a pan full of flour and some rocks to create a moonscape.
Tsunami: Waves of Destruction
Source Institutions
In this activity, learners use tsunami time travel maps to predict how long it will take a tsunami to reach the shore.
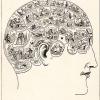
Mapping the Homunculus
Source Institutions
In this activity, learners will explore how the human brain interprets environmental stimuli.
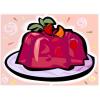
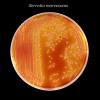
There's Always Room For JELL-O
Source Institutions
In this activity, learners cut wells in JELL-O© and load the wells with different detergent solutions.
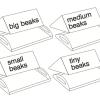
Clippy Island: An Investigation into Natural Selection
Source Institutions
In this activity, leaners will observe the process of natural selection on a population of birds called 'Springbeaks' over four seasons of breeding on an isolated environment called 'Clippy Island.' L
Slide Rules
Source Institutions
Learners make their own simple slide rules out of paper and learn how they work.
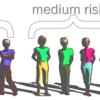
Risk Continuum
Source Institutions
This activity is a whole-group kinesthetic demonstration that shows learners what it means to be in a "risk group" for developing heart disease based on family history and genetics.
Sizing Up Temperature
Source Institutions
In this activity, learners explore Charles' Law in a syringe.
Pick the Risk: The Polygenic Pedigree Challenge
Source Institutions
In this activity, learners are challenged to track and record the passage of colored pom poms (representing genes) through generations of a family using a pedigree.
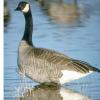
Canada Goose: Explore Trends With Data
Source Institutions
In this activity, learners will explore trends in Canada goose populations using real data from the National Audubon Society's Christmas Bird Count.
Demonstrating An Epidemic
Source Institutions
This experiment allows learners to experience a small scale "epidemic," demonstrating the ease with which disease organisms are spread, and enables learners to determine the originator of the "epidemi
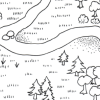
Mapping a Study Site
Source Institutions
In this outdoor activity, learners use a mapping technique to become oriented to the major features of an outdoor site.

Building a Magic Carpet
Source Institutions
In this activity (page 89 of the PDF), learners compare and contrast pitch and roll motions by using a Magic Carpet maze similar to one that was used for Neurolab investigations about microgravity.
Raising the Level of Carbon Dioxide in Your Blood
Source Institutions
In this activity (on page 146 of the PDF), learners will explore the effects of increased carbon dioxide in the bloodstream.