Search Results
Showing results 141 to 160 of 235
Raising the Level of Carbon Dioxide in Your Blood
Source Institutions
In this activity (on page 146 of the PDF), learners will explore the effects of increased carbon dioxide in the bloodstream.
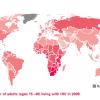
Mapping the Spread of HIV/AIDS: Trailing the Pandemic
Source Institutions
In this activity, learners act as epidemiologists by mapping the prevalence of HIV/AIDS worldwide.
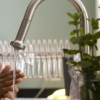
Home Water Audit
Source Institutions
This activity offers learners and their families several ways to raise their awareness together about home water.
Measuring Blood Pressure in Space
Source Institutions
In this activity (page 105 of the PDF), learners measure heart rate and blood pressure and learn how to obtain consistent measurements during repeated tests.
What Cells Can I See in Muscle and Spinal Cord Tissues?
Source Institutions
In this activity (page 37 of the PDF), learners observe, on a prepared slide, muscle and spinal cord cells from a rat.
How Greenhouse Gases Absorb Heat
Source Institutions
Learners observe two model atmospheres -- one with normal atmospheric composition and another with an elevated concentration of carbon dioxide.
How Sweet It Is
Source Institutions
In this activity (4th activity on the page), learners use their sense of smell to rate and arrange containers filled with different dilutions of a scent (like cologne or fruit juice) in order from wea
A Penny Saved is a Penny Heard
Source Institutions
In this activity (11th activity on the page), learners use pennies to test their hearing acuity.
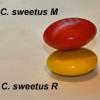
Survival of the Fittest: Variations in the Clam Species Clamys sweetus
Source Institutions
This guided inquiry three-part activity engages learners in thinking about the mechanism of natural selection by encouraging them to formulate questions that can be answered through scientific investi
Survival of the Fittest: Battling Beetles
Source Institutions
This guided inquiry three-part activity engages learners in thinking about the mechanism of natural selection through data collection and pattern recognition.

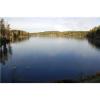
Water Walk
Source Institutions
Learners take a field trip along a local body of water and conduct a visual survey to discover information about local land use and water quality.
Atmosphere Composition Model
Source Institutions
In this activity, learners create a model using metric measuring tapes and atmosphere composition data.
Harmful Algal Blooms: In Full Bloom
Source Institutions
In this activity, learners will investigate the impacts of harmful phytoplankton using NOAA's Coastal Services Center Harmful Algal Bloom Forecasting (HABF) Project data.

Terrestrial Hi-Lo Hunt
Source Institutions
In this outdoor activity, learners search for the warmest and coolest, windiest and calmest, wettest and driest, and brightest and darkest spots in an area.
Trees: Recorders of Climate Change
Source Institutions
In this activity, learners are introduced to tree rings by examining a cross section of a tree, also known as a “tree cookie.” They discover how tree age can be determined by studying the rings and ho
Rainbow Film
Source Institutions
In this activity, learners use clear nail polish to create a beautiful iridescent pattern on black paper. Learners discover that a thin film creates iridescent, rainbow colors.
Built in Stopwatch
Source Institutions
In this activity (3rd on the page), learners investigate circadian rhythms by examining how well people do with estimating time.
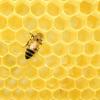
Honeycomb Geometry
Source Institutions
In this activity, learners will build a honeycomb. Learners will investigate how the shape of the honeycomb develops. Activity includes step-by-step instructions and extension ideas.
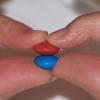
Exponential Models: Rhinos and M&M’s ®
Source Institutions
In this math lesson, learners model exponential decay and exponential growth using M&M's, paper folding, and African rhino population data.