Search Results
Showing results 221 to 240 of 377
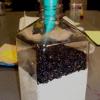
Earth Atmosphere Composition
Source Institutions
In this activity, learners use rice grains to model the composition of the atmosphere of the Earth today and in 1880. Learners assemble the model while measuring percentages.
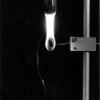
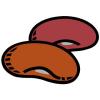
Burn a Peanut
Source Institutions
In this activity, learners burn a peanut, which produces a flame that can be used to boil away water and count the calories contained in the peanut.
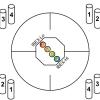
Particle Detection
Source Institutions
By tossing, collecting, and sorting beanbags, learners understand how the IBEX spacecraft uses its sensors to detect and map the locations of particle types in the interstellar boundary.
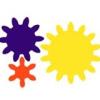
Gene Switches
Source Institutions
In this activity, learners explore how genetic switches function and the role of genetic switches in the process of evolution.
Not Just A Bag Of Beans
Source Institutions
In this activity, learners count and measure kidney beans to explore natural selection and variation. Learners measure the length of 50-100 beans.

Fast Rusting
Source Institutions
In this activity, learners conduct an experiment to find out if steel wool will weigh more or less when it is burned. Learners will explore the effects of oxidation and rusting on the steel wool.
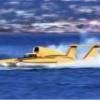
Fun with Speedboats
Source Institutions
In this activity, learners explore how boats are engineered to achieve speed.
Life Size: Line 'em up!
Source Institutions
In this activity on page 1 of the PDF, learners compare the relative sizes of biological objects (like DNA and bacteria) that can't be seen by the naked eye.
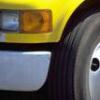
How the Rubber Meets the Road
Source Institutions
In this activity, learners explore how engineers design tire treads to increase safety and reliability.
Carbon Configurations
Source Institutions
In this activity, learners use geometry to predict the shape of carbon. Learners twist and attach chenille stem pieces that represent bonds between different carbon atoms.
Scale Model of Sun and Earth
Source Institutions
In this activity, learners explore the relative size of the Sun and Earth as well as the distance between them.
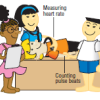
Changing Body Positions: How Does the Circulatory System Adjust?
Source Institutions
In this activity about how the body regulates blood pressure (page 117 of the PDF), learners make and compare measurements of heart rate and blood pressure from three body positions: sitting, standing
The Ins and Outs of Tides: Learn About Causes and Predictions
Source Institutions
In this activity, learners will compare predicted and observed tides using data from The National Oceanic and Atmospheric Administration(NOAA).
The Blue Crab's Chesapeake Journey
Source Institutions
In this data collection activity about crabs, learners use data from the Virginia Institute of Marine Science (VIMS) trawl survey to determine the areas of the Chesapeake Bay that are being used by bl
Tsunami: Waves of Destruction
Source Institutions
In this activity, learners use tsunami time travel maps to predict how long it will take a tsunami to reach the shore.
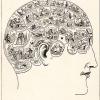
Mapping the Homunculus
Source Institutions
In this activity, learners will explore how the human brain interprets environmental stimuli.
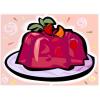
There's Always Room For JELL-O
Source Institutions
In this activity, learners cut wells in JELL-O© and load the wells with different detergent solutions.
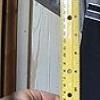
Auditory Acuity
Source Institutions
This activity (8th activity on the page) tests learners' ability to identify things using only the sense of hearing.
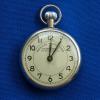
How Fast Are You?
Source Institutions
This activity is designed to let learners measure their reaction time or response time to something they see.

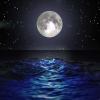
Telescopes as Time Machines
Source Institutions
This fun, nighttime hands-on astronomy activity lets learners explore how long it takes for light from different objects in the universe to reach Earth.