Search Results
Showing results 21 to 40 of 44
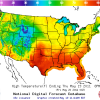
The Daily Ups and Downs
Source Institutions
In this activity, learners graph 48 hourly air temperatures from a local weather observation site and observe the diurnal temperature variations.
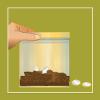
Creating a Soil Map
Source Institutions
In this activity, learners investigate soil conditions by creating a soil map. Learners record soil characteristics and compare the conditions of soil in different grid sections.
Updrafts in Action
Source Institutions
In this weather activity/demonstration, learners watch as a ping pong ball is suspended in a stream of air supplied by a hair dryer.
The Return of El Nino
Source Institutions
In this activity related to climate change and data analysis, learners examine temperature and precipitation data to determine if climate variations are due to El Niño.
It's the "Rain," Man
Source Institutions
In this weather forecasting activity, learners use common materials to construct a rain gauge and measure daily, monthly, and yearly rainfall.
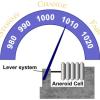
Measure the Pressure II: The "Dry" Barometer
Source Institutions
In this activity, learners use simple items to construct a device for indicating air pressure changes.
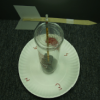
Catch the Wind
Source Institutions
In this weather activity (page 1 of the PDF), learners will construct their very own anemometer to measure wind speed.
Weather Forecasting
Source Institutions
This activity (on page 2 of the PDF under SciGirls Activity: Forecasting) is a full inquiry investigation into meteorology and forecasting.
Drawing Conclusions
Source Institutions
In this weather forecasting activity, learners determine the location of cold and warm fronts on weather plot maps.
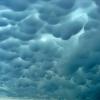
Head in the Clouds
Source Institutions
In this activity, learners create a CloudSpotter wheel and record the different types of clouds they observe twice daily over several days.
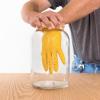
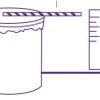
Fog Chamber
Source Institutions
In this weather-related activity, learners make a portable cloud in a bottle.
Forward Thinking
Source Institutions
In this activity, learners create their own weather forecast map.
AM in the PM
Source Institutions
In this activity, learners will listen to as many radio stations as possible to discover that AM radio signals can travel many hundreds of miles at night.
If Anyone Can, Icon
Source Institutions
In this activity, learners create their own icons for a forecast-at-a-glance poster for their classroom/learning space.
Weather Vane
Source Institutions
In this meteorology activity, learners build weather vanes using straws, paperclips, and cardstock.
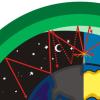
Weather Stations: Winds
Source Institutions
In this activity, learners use a toaster to generate wind and compare the appliance's heat source to Jupiter's own hot interior. Learners discover that convection drives wind on Jupiter and on Earth.
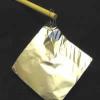
Water Cycle in a Bag
Source Institutions
In this activity, learners create a biosphere in a baggie.
I Can't Take the Pressure!
Learners develop an understanding of air pressure in two different activities.
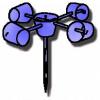
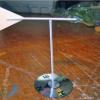
Design and Build a Wind Vane
Source Institutions
In this activity, learners design and build a simple wind vane —one of the oldest kinds of weather tools— and use it to show wind direction.
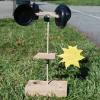
Weather Vane and Anemometer
Source Institutions
In this meteorology activity, learners construct simple devices to measure the direction and speed of wind.