Search Results
Showing results 81 to 100 of 132
Haunted by Hurricanes: Use Data to Learn About Hurricanes
Source Institutions
In this activity, learners will determine if the frequency and intensity of hurricanes are changing using real data from the National Hurricane Center.
The Return of El Nino
Source Institutions
In this activity related to climate change and data analysis, learners examine temperature and precipitation data to determine if climate variations are due to El Niño.
Seedy Travelers
Source Institutions
In this activity (on pages 18-28), learners explore how the shape of seeds affects how they are dispersed by wind, birds, ocean currents and other means.
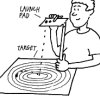
Floodplain Modeling
In this design-based lesson, learners study flood dynamics as they modify a riverbed with blockages or levees to simulate real-world scenarios.
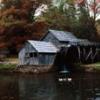
Working with Watermills
Source Institutions
In this activity, learners explore how watermills have helped harness energy from water through the ages.

Geometry and Spatial Relations: Tessellations WOW!
Source Institutions
In this math lesson, learners explore tessellations through literature, music, writing, and art activities.
Conductivity: Salty Water
Source Institutions
Water, whether fresh or salty, serves as one of the best electrical conductors on the planet. Does salt effect its conductivity?
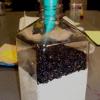
Earth Atmosphere Composition
Source Institutions
In this activity, learners use rice grains to model the composition of the atmosphere of the Earth today and in 1880. Learners assemble the model while measuring percentages.
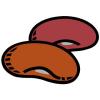
Not Just A Bag Of Beans
Source Institutions
In this activity, learners count and measure kidney beans to explore natural selection and variation. Learners measure the length of 50-100 beans.
Cool Tool
Source Institutions
In this activity (on pages 10-17), learners discover how scientists study biodiversity and the health of the environment based on inspection of small areas—a process known as sampling.
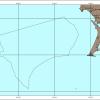
West Coast Shipwrecks
Source Institutions
In this data activity, learners will explore shipwrecks from four National Marine Sanctuaries on the West Coast of the United States.
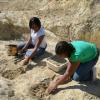
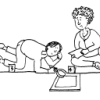
Shoebox Dinosaur Dig Site
Source Institutions
In this activity, (on page 6 of the PDF under SciGirls Activity: Dinosaurs) learners participate in a hands-on fossil excavation.
The Blue Crab's Chesapeake Journey
Source Institutions
In this data collection activity about crabs, learners use data from the Virginia Institute of Marine Science (VIMS) trawl survey to determine the areas of the Chesapeake Bay that are being used by bl
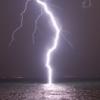
Tsunami: Waves of Destruction
Source Institutions
In this activity, learners use tsunami time travel maps to predict how long it will take a tsunami to reach the shore.
Shadow Play
Source Institutions
In this three part activity, learners explore and experiment with shadows to learn about the Sun's relative motion in the sky.
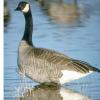
Canada Goose: Explore Trends With Data
Source Institutions
In this activity, learners will explore trends in Canada goose populations using real data from the National Audubon Society's Christmas Bird Count.
BioBlitz
Source Institutions
In this activity (on page 2 of the PDF under GPS: Biodiversity Activity), learners will pair up and take a notebook outdoors to a selected location to observe and record a list of living things that t
Survival of the Fittest: Battling Beetles
Source Institutions
This guided inquiry three-part activity engages learners in thinking about the mechanism of natural selection through data collection and pattern recognition.
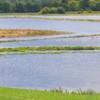
Water Walk
Source Institutions
Learners take a field trip along a local body of water and conduct a visual survey to discover information about local land use and water quality.
Harmful Algal Blooms: In Full Bloom
Source Institutions
In this activity, learners will investigate the impacts of harmful phytoplankton using NOAA's Coastal Services Center Harmful Algal Bloom Forecasting (HABF) Project data.