Search Results
Showing results 101 to 120 of 151
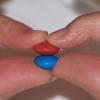
Survival of the Fittest: Battling Beetles
Source Institutions
This guided inquiry three-part activity engages learners in thinking about the mechanism of natural selection through data collection and pattern recognition.
Catch the Wind
Source Institutions
In this weather activity (page 1 of the PDF), learners will construct their very own anemometer to measure wind speed.
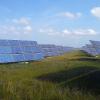
Solar Cell Simulation
Source Institutions
In this activity, learners model the flow of energy from the sun as it enters a photovoltaic cell, moves along a wire and powers a load.
Zero-Energy Housing
In this activity, learners investigate passive solar building design with a focus solely on heating.
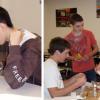
Make a Wire Critter That Can Walk on Water
Source Institutions
In this activity, learners make water-walking critters using thin wire, and then test how many paper clips these critters can carry without sinking.
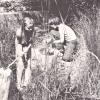
What Lives Here
Source Institutions
In this outdoor activity/field trip, learners explore an aquatic site such as a pond, lake, stream, river or seashore to find and investigate plants and animals that live in water.

Breathing Blue
Source Institutions
In this activity, learners test exhaled breath for carbon dioxide and learn how to use an indicator as a simple way to measure pH.
Density Intensity
Source Institutions
In this activity on page 12 of the PDF (Rethinking the 3 R’s: It’s Easy to be Green), learners examine how recyclable materials are separated by various properties at recycling centers.
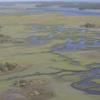
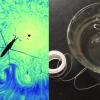
Nutrients in an Estuary
Source Institutions
In this activity, learners model estuaries, artificially enriching both fresh and salt water samples with different amounts of nutrients and observing the growth of algae over several weeks.
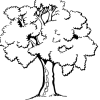
Tree-mendous Plots
Source Institutions
In this math lesson, learners record and graph plant growth and interpret data. Learners plant seeds, and once the seeds sprout, record the change in height of the plants for several days.
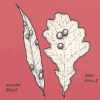
Swell Homes
Source Institutions
In this outdoor activity, learners find the swollen bumps known as "galls" on various plants and get a closeup look at the parasitic animals living inside.
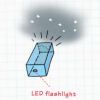
Star Power
Source Institutions
In this activity, learners create a star show and discover how they can prevent light pollution. Using simple materials, learners first design constellation boxes.
Photosynthetic Pictures Are Worth More Than a Thousand Words
Source Institutions
This activity provides an opportunity for learners to observe and examine how carbon dioxide, water, and light produce glucose/starch through a process called photosynthesis.
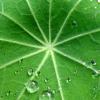
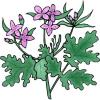
Lotus Leaf Effect
Source Institutions
This is a demonstration about how nature inspires nanotechnology. It is easily adapted into a hands-on activity for an individual or groups.
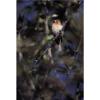
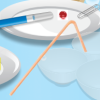
The Beaks of the Finches
Source Institutions
In this simulation, learners become birds different beak types. Learners use various tools to represent beaks to pick up seeds and place them in a petri dish.
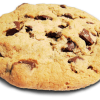
Chocolate Chip Cookie Constellations
Source Institutions
This chocolate chip cookie recipe includes templates for baking night sky constellations of the season right on top! Two templates are included, one for 9pm mid-April, and one for 10pm mid-July.
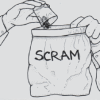
Scram or Freeze
Source Institutions
In this outdoor activity and animal-role-play game, learners discover and uncover the hidden world of "cryptozoa"—organisms such as spiders, salamanders and slugs that live under objects, like rocks a
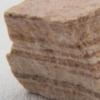
A Crayon Rock Cycle- Sedimentary
Source Institutions
This is part 1 of the three-part "Crayon Rock Cycle" activity. In this activity, learners explore how sedimentary rocks form.
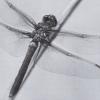
Damsels and Dragons
Source Institutions
In this outdoor activity/field trip, learners conduct experiments to explore where dragonflies and damselflies perch or rest, and how the flies change behavior in reaction to other flies or fly decoys
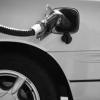
Automotive Emissions and the Greenhouse Effect
Source Institutions
In this activity about global climate change, learners will conduct an experiment and collect data to compare the amount of carbon dioxide (CO2) in four different sources of gases.