Search Results
Showing results 1 to 15 of 15
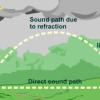
The Rumblin' Road: Determining distance to a Thunderstorm
Source Institutions
In this activity, learners discover how to determine the distance to a lightning strike or nearby thunderstorm.
Bird Bingo
Source Institutions
In this activity, learners play bingo to learn about the diversity of birds. This game includes a warm-up lesson and "Full Flight" version.
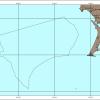
West Coast Shipwrecks
Source Institutions
In this data activity, learners will explore shipwrecks from four National Marine Sanctuaries on the West Coast of the United States.
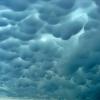
Head in the Clouds
Source Institutions
In this activity, learners create a CloudSpotter wheel and record the different types of clouds they observe twice daily over several days.
Plastic Bag Creations
Source Institutions
In this activity, learners will reuse plastic bags in an interesting way.
Haunted by Hurricanes: Use Data to Learn About Hurricanes
Source Institutions
In this activity, learners will determine if the frequency and intensity of hurricanes are changing using real data from the National Hurricane Center.
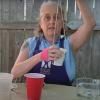
Anti-Gravity Cups
Source Institutions
In this activity, learners will use simple materials to explore centripetal force and variables by swinging a cup of water without having the water spill out.
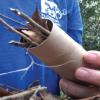
Discovery Time: Bugs
Source Institutions
In this activity, young learners (2 years and up) explore the world of insects and other "bugs" by Making a "bug hotel" with recycled objects.
Bird Watching
Source Institutions
In this activity, learners will observe birds in their backyard or local park. They will attempt to find common Ohio birds and will look for bird behaviors just like an ornithologist.
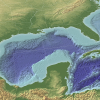
The Dead Zone: A Marine Horror Story
Source Institutions
In this environmental science and data analysis activity, learners work in groups to track a Dead Zone (decreased dissolved oxygen content of a body of water) using water quality data from the Nutrien
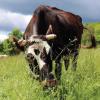
Sustainable Grazing
Source Institutions
In this activity, learners investigate the food, water, and space needs of common livestock animals.
Mapping Mockingbirds
Source Institutions
This lesson plan revolves around studying the speciation of the Galápagos mockingbirds, which are on display at the California Academy of Sciences.

Natural Selection in Protected and Unprotected Populations
Source Institutions
In this simulation, learners model two elephant seal populations and how they change over time. Learners start with cards representing a variety of seals.
The Carbon Cycle: Carbon Tracker
Source Institutions
In this activity, learners play NOAA's Carbon Tracker game and discover ways to keep track of carbon dioxide and other greenhouse gases in the world.
Harmful Algal Blooms: In Full Bloom
Source Institutions
In this activity, learners will investigate the impacts of harmful phytoplankton using NOAA's Coastal Services Center Harmful Algal Bloom Forecasting (HABF) Project data.