Search Results
Showing results 1 to 10 of 10
Dripping Wet or Dry as a Bone?
Learners investigate the concept of humidity by using a dry and wet sponge as a model. They determine a model for 100% humidity, a sponge saturated with water.
A Recipe for Air
Learners use M&Ms® (or any other multi-color, equally-sized small candy or pieces) to create a pie graph that expresses the composition of air.
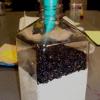
Earth Atmosphere Composition
Source Institutions
In this activity, learners use rice grains to model the composition of the atmosphere of the Earth today and in 1880. Learners assemble the model while measuring percentages.

Water, Water Everywhere
Source Institutions
In this activity, learners estimate how much water they think can be found in various locations on the Earth in all its states (solid, liquid, and gas) to discover the different water ratios in the Ea
Air Pressure and Dent Pullers
Source Institutions
In this activity, learners simulate Otto von Guericke's famous Magdeburg Hemispheres experiment.
Arctic Sea Ice
Source Institutions
In this activity, learners explore how the area of Arctic sea ice has changed over recent years. First, learners graph the area of Arctic sea ice over time from 1979 to 2007.
Sea State: Forecast Conditions at Sea
Source Institutions
In this oceanography and data collection activity, learners cast real time sea state conditions using buoys from NOAA's National Data Buoy Center.

Percentage of Oxygen in the Air
Source Institutions
In this activity, learners calculate the percentage of oxygen in the atmosphere by using steel wool's ability to rust.

Atmosphere Composition Model
Source Institutions
In this activity, learners create a model using metric measuring tapes and atmosphere composition data.