Search Results
Showing results 1 to 8 of 8
Arctic Sea Ice
Source Institutions
In this activity, learners explore how the area of Arctic sea ice has changed over recent years. First, learners graph the area of Arctic sea ice over time from 1979 to 2007.
Mapping Greenhouse Gas Emissions Where You Live
Source Institutions
In this lesson plan, learners examine some of the of greenhouse gas emissions sources in their community.
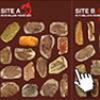
Prehistoric Climate Change
Source Institutions
In this online interactive, learners use fossils to infer temperatures 55 million years ago, at the sites where the fossils were found.
The Carbon Cycle and its Role in Climate Change: Activity 2
Source Institutions
In this activity (on page 7), learners explore the meaning of a "carbon sink." Using simple props, learners and/or an educator demonstrate how plants act as carbon sinks and how greenhouse gases cause
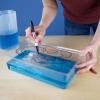
Exploring Earth: Rising Sea
Source Institutions
“Exploring Earth: Rising Sea” is a hands-on activity demonstrating ways to use topographical mapping techniques to track changes in sea level. The activity is connected to current NASA research.
The Carbon Cycle: How It Works
Source Institutions
In this game, learners walk through an imaginary Carbon Cycle and explore the ways in which carbon is stored in reservoirs and the processes that transport the carbon atom from one location to another
Energy Audit
Source Institutions
In this lesson, learners will practice graphing and statistically analyzing data.
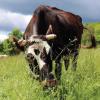
Sustainable Grazing
Source Institutions
In this activity, learners investigate the food, water, and space needs of common livestock animals.