Search Results
Showing results 1 to 8 of 8
Lava Layering: Making and Mapping a Volcano
Source Institutions
In this activity, learners discover how geologists use stratigraphy, the study of layered rock, to understand the sequence of geological events.
The Daily Ups and Downs
Source Institutions
In this activity, learners graph 48 hourly air temperatures from a local weather observation site and observe the diurnal temperature variations.
Creating a Soil Map
Source Institutions
In this activity, learners investigate soil conditions by creating a soil map. Learners record soil characteristics and compare the conditions of soil in different grid sections.
Using Different Models of Earth
Source Institutions
In this activity, learners explore how the shapes, sizes, and distances of land masses appear differently on two different models of Earth: an icosahedron and a flat map.
Drawing Conclusions
Source Institutions
In this weather forecasting activity, learners determine the location of cold and warm fronts on weather plot maps.
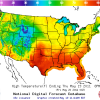
Forward Thinking
Source Institutions
In this activity, learners create their own weather forecast map.

If Anyone Can, Icon
Source Institutions
In this activity, learners create their own icons for a forecast-at-a-glance poster for their classroom/learning space.
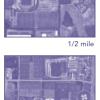
Aerial Imagery
Source Institutions
This activity (on page 2 of the PDF under SciGirls Activity: Earthquakes) is a full inquiry investigation into aerial imagery.