Search Results
Showing results 21 to 29 of 29

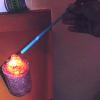
Hot Stuff!: Testing Ice
In this demonstration, learners compare and contrast regular water ice to dry ice (frozen carbon dioxide). Both samples are placed in a solution of acid-base indicator.
The Carbon Cycle: Carbon Tracker
Source Institutions
In this activity, learners play NOAA's Carbon Tracker game and discover ways to keep track of carbon dioxide and other greenhouse gases in the world.
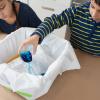
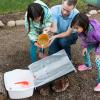
Human Impact on Estuaries: A Terrible Spill in Grand Bay
Source Institutions
In this activity, learners make a model of a pollution spill that occurred at Bangs Lake in Mississippi and measure water quality parameters in their model.
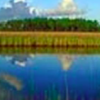
Make a Lake
Source Institutions
Where rainwater goes after the rain stops? And why there are rivers and lakes in some parts of the land but not in others?
Battling for Oxygen
Working in groups, learners model the continuous destruction and creation of ozone (O3) molecules, which occur in the ozone layer.
The Effects of Acid Rain
Source Institutions
In this environmental science activity (page 4 of the PDF), learners use vinegar and chalk to observe the effect of acid rain on various building materials and plant life.
Runaway Runoff
Source Institutions
When it rains, water can collect on top of and seep into the ground. Water can also run downhill, carrying soil and pollution with it.
Hot Stuff!: Investigation #3
Learners test two jars of ice water, one covered and one open, for changes in temperature. After placing the jars in the sun, learners discover that the covered jar cools down more slowly.
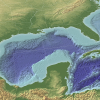
The Dead Zone: A Marine Horror Story
Source Institutions
In this environmental science and data analysis activity, learners work in groups to track a Dead Zone (decreased dissolved oxygen content of a body of water) using water quality data from the Nutrien