Search Results
Showing results 61 to 80 of 108
Our Sense of Sight: How We Perceive Movement, Depth and Illusions
Source Institutions
In this activity, learners investigate visual perception as well as plan and conduct their own experiments.
Hockey Stick Power!
Source Institutions
This activity (on page 2 of the PDF under SciGirls Activity: Hockey) is a full inquiry investigation into how a hockey stick’s flex affects shooting power and accuracy.
Trash Talkin'
In this activity, learners collect, categorize, weigh and analyze classroom trash and discuss ways that engineers have helped to reduce solid waste.
House Warming
Source Institutions
In this physical sciences activity, learners explore how passive solar design increases energy efficiency.
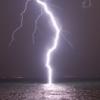
Haunted by Hurricanes: Use Data to Learn About Hurricanes
Source Institutions
In this activity, learners will determine if the frequency and intensity of hurricanes are changing using real data from the National Hurricane Center.
The Return of El Nino
Source Institutions
In this activity related to climate change and data analysis, learners examine temperature and precipitation data to determine if climate variations are due to El Niño.
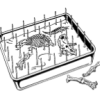
Classroom Dinosaur Dig
Source Institutions
In this activity, learners participate in a simulated dig to discover fossilized dinosaur bones. Learners take notes, make a map and propose theories about dinosaurs.
Conductivity: Salty Water
Source Institutions
Water, whether fresh or salty, serves as one of the best electrical conductors on the planet. Does salt effect its conductivity?
Cool Tool
Source Institutions
In this activity (on pages 10-17), learners discover how scientists study biodiversity and the health of the environment based on inspection of small areas—a process known as sampling.
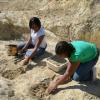
Shoebox Dinosaur Dig Site
Source Institutions
In this activity, (on page 6 of the PDF under SciGirls Activity: Dinosaurs) learners participate in a hands-on fossil excavation.
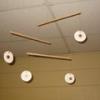
Rotational Equilibrium
Source Institutions
In this activity, learners explore the concept of rotational equilibrium. Learners work in teams to estimate and determine the force within a mobile design.
Mix It Up
Source Institutions
In this math lesson, learners are introduced to proportional reasoning through modeling, sharing, and questioning techniques.
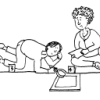
Gravity and Muscles
Source Institutions
In this activity about center of gravity (page 23 of PDF), learners investigate how the body adjusts to the force of gravity to remain balanced.
The Blue Crab's Chesapeake Journey
Source Institutions
In this data collection activity about crabs, learners use data from the Virginia Institute of Marine Science (VIMS) trawl survey to determine the areas of the Chesapeake Bay that are being used by bl
Tsunami: Waves of Destruction
Source Institutions
In this activity, learners use tsunami time travel maps to predict how long it will take a tsunami to reach the shore.
Sizing Up Temperature
Source Institutions
In this activity, learners explore Charles' Law in a syringe.
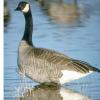
Canada Goose: Explore Trends With Data
Source Institutions
In this activity, learners will explore trends in Canada goose populations using real data from the National Audubon Society's Christmas Bird Count.
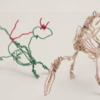
Size, Scale and Models
Source Institutions
In this activity, learners take measurements and create charts to learn about the size of dinosaurs and their relative scale to humans.
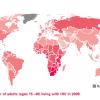
Mapping the Spread of HIV/AIDS: Trailing the Pandemic
Source Institutions
In this activity, learners act as epidemiologists by mapping the prevalence of HIV/AIDS worldwide.
Lungometer
Source Institutions
In this environmental health activity, learners investigate their own vital lung capacities.