Search Results
Showing results 101 to 120 of 167
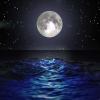
The Ins and Outs of Tides: Learn About Causes and Predictions
Source Institutions
In this activity, learners will compare predicted and observed tides using data from The National Oceanic and Atmospheric Administration(NOAA).
Tsunami: Waves of Destruction
Source Institutions
In this activity, learners use tsunami time travel maps to predict how long it will take a tsunami to reach the shore.
Auditory Acuity
Source Institutions
This activity (8th activity on the page) tests learners' ability to identify things using only the sense of hearing.
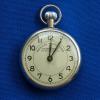
How Fast Are You?
Source Institutions
This activity is designed to let learners measure their reaction time or response time to something they see.
Right Ear/Left Ear
Source Institutions
In this activity (4th on the page), learners conduct a series of tests to find out which of their ears is more dominant.
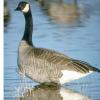
Canada Goose: Explore Trends With Data
Source Institutions
In this activity, learners will explore trends in Canada goose populations using real data from the National Audubon Society's Christmas Bird Count.
Guess My Rule
Source Institutions
In this activity, learners play a guessing game to explore classification.
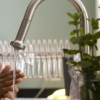
Home Water Audit
Source Institutions
This activity offers learners and their families several ways to raise their awareness together about home water.
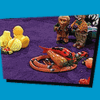
BioBlitz
Source Institutions
In this activity (on page 2 of the PDF under GPS: Biodiversity Activity), learners will pair up and take a notebook outdoors to a selected location to observe and record a list of living things that t
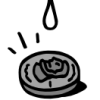
Drops on a Penny
Source Institutions
In this activity, challenge learners to predict and investigate how many water drops they can fit on one penny.
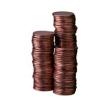
A Penny Saved is a Penny Heard
Source Institutions
In this activity (11th activity on the page), learners use pennies to test their hearing acuity.
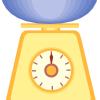
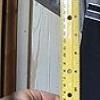
Heavy or Light
Source Institutions
In this activity, learners explore a scale by comparing objects, which look similar but have different weights. Learners predict and then measure the weights of various objects using a scale.
Harmful Algal Blooms: In Full Bloom
Source Institutions
In this activity, learners will investigate the impacts of harmful phytoplankton using NOAA's Coastal Services Center Harmful Algal Bloom Forecasting (HABF) Project data.
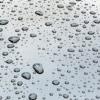
Atmospheric Collisions
Source Institutions
In this activity/demonstration, learners observe what happens when two ping pong balls are suspended in the air by a hair dryer. Use this activity to demonstrate how rain drops grow by coalescence.
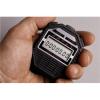
Built in Stopwatch
Source Institutions
In this activity (3rd on the page), learners investigate circadian rhythms by examining how well people do with estimating time.
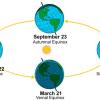
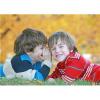
The Shadow Knows I
Source Institutions
In this activity, learners will measure the length of their shadow from the Sun and compare it three to four months later.
Drawing Conclusions
Source Institutions
In this weather forecasting activity, learners determine the location of cold and warm fronts on weather plot maps.
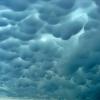
Head in the Clouds
Source Institutions
In this activity, learners create a CloudSpotter wheel and record the different types of clouds they observe twice daily over several days.
Line Up: Using Math To Stand In Line
Source Institutions
Put math of measurement into lining up — and make waiting in line fun. Choose a size characteristic that learners can physically compare, such as foot length or hair length.
Greeting Card Boxes
Source Institutions
In this activity, learners make cool boxes out of old (or new) greeting cards or postcards.