Search Results
Showing results 1 to 20 of 28
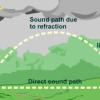
The Rumblin' Road: Determining distance to a Thunderstorm
Source Institutions
In this activity, learners discover how to determine the distance to a lightning strike or nearby thunderstorm.
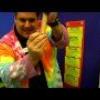
Incredible Shrinking Shapes
Source Institutions
In this activity, learners get hands-on experience with ratios and scaling while making their own jewelry out of recycled plastic containers.
Atmospheric Collisions
Source Institutions
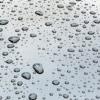
In this activity/demonstration, learners observe what happens when two ping pong balls are suspended in the air by a hair dryer. Use this activity to demonstrate how rain drops grow by coalescence.
The Carbon Cycle: How It Works
Source Institutions
In this game, learners walk through an imaginary Carbon Cycle and explore the ways in which carbon is stored in reservoirs and the processes that transport the carbon atom from one location to another
Can Crushers
Source Institutions
In this activity, learners conduct an experiment by heating an aluminum can filled with water to investigate air pressure.
Drawing Conclusions
Source Institutions
In this weather forecasting activity, learners determine the location of cold and warm fronts on weather plot maps.
Haunted by Hurricanes: Use Data to Learn About Hurricanes
Source Institutions
In this activity, learners will determine if the frequency and intensity of hurricanes are changing using real data from the National Hurricane Center.
The Return of El Nino
Source Institutions
In this activity related to climate change and data analysis, learners examine temperature and precipitation data to determine if climate variations are due to El Niño.
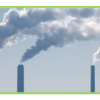
Mapping Greenhouse Gas Emissions Where You Live
Source Institutions
In this lesson plan, learners examine some of the of greenhouse gas emissions sources in their community.
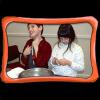
Slowing the Flow
Source Institutions
In this experiment, pairs of learners explore how cold water affects circulation. The mammalian diving reflex (MDR) slows circulation when the body is exposed to cold water.
Toasty Wind
Source Institutions
In this quick activity, learners use a toaster to investigate the source for the Earth's wind. Learners hold a pinwheel above a toaster to discover that rising heat causes wind.
"Can" You Stand the Pressure
Source Institutions
In this activity about states of matter, learners get to witness firsthand the awesome power of air pressure. They watch as an ordinary soda can is crushed by invisible forces.
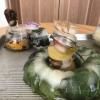
Frozen Sculptures
Source Institutions
In this activity, learners use objects they find on a nature and water to make creative frozen sculptures.
The Carbon Cycle and its Role in Climate Change: Activity 2
Source Institutions
In this activity (on page 7), learners explore the meaning of a "carbon sink." Using simple props, learners and/or an educator demonstrate how plants act as carbon sinks and how greenhouse gases cause
The Daily Ups and Downs
Source Institutions
In this activity, learners graph 48 hourly air temperatures from a local weather observation site and observe the diurnal temperature variations.
The Great Balloon Race
Source Institutions
In this online Flash game, learners take to the skies in a hot air balloon and are challenged to beat other balloonists' times to the finish line without crashing.
Fish Eyes: More than Meets the Eye
Source Institutions
In this data collection and analysis activity, learners evaluate fish physiology and ecology using vision research data from Dr.
Shrinkers: Cook up some plastic!
Source Institutions
In this activity (on page 2 of the PDF), learners (with adult help and supervision) investigate how heat affects polystyrene plastic.
What is a "Model"?
Source Institutions
In this activity, learners simulate the behavior of the atmosphere.
The Dead Zone: A Marine Horror Story
Source Institutions
In this environmental science and data analysis activity, learners work in groups to track a Dead Zone (decreased dissolved oxygen content of a body of water) using water quality data from the Nutrien