Search Results
Showing results 21 to 40 of 228
Why Doesn’t the Ocean Freeze?
Source Institutions
In this activity, learners explore how salt water freezes in comparison to fresh water.
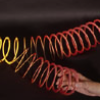
Seismic Slinky!
Source Institutions
Did you know that a Slinky makes a handy model of earthquake waves?
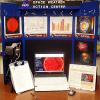
Space Weather Action Center
Source Institutions
In this interdisciplinary activity, learners create a Space Weather Action Center (SWAC) to monitor solar storms and develop real SWAC news reports.
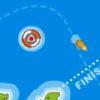
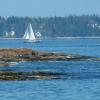
Cup Sailing Game
Source Institutions
In this online Flash game, learners will captain a sailing challenge, adjusting boat direction and sails, seeking the way to take greatest advantage of varying wind speeds and directions to catch the
Whose Fault Is It?
Source Institutions
In this seismic simulation, learners play a "who-dunnit" game to explore earthquakes.
It's a Gas, Man
Source Institutions
In this activity, learners discover if carbon dioxide has an effect on temperature.
Coastal Erosion: Where's the Beach?
Source Institutions
Learners use beach profile data from a local beach or online data from Ocean City, Maryland to investigate coastal erosion and sediment transport.
Twirling in the Breeze
Source Institutions
In this engineering activity, learners build a device (an anemometer) to measure how fast the wind is blowing.
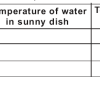
Cool Trees
Source Institutions
This warm weather activity introduces learners to the impact trees have on blocking the sun's heat and reducing temperature on the Earth's surface.
The Carbon Cycle and its Role in Climate Change: Activity 3
Source Institutions
In this activity, learners explore the human influences on the carbon cycle and examine how fossil fuels release carbon.
Running in Circles
Source Institutions
In this group activity, learners use some common objects and work together to simulate the Coriolis effect. During the challenge, learners make predictions and test different scenarios.
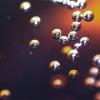
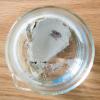
Exploring Earth: Investigating Clouds
Source Institutions
“Exploring Earth: Investigating Clouds” is a hands-on activity in which visitors create a cloud in a bottle and explore it with laser light.
Shell Shifts
Source Institutions
Ocean acidification is a big issue due to the amount of carbon dioxide humans release. CO2 in the atmosphere is absorbed into the ocean thus changing its acidity.
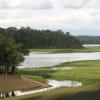
Amazon Water Cycle Roleplay
Source Institutions
In this creative roleplay activity, learners will explore the various processes of the water cycle using movement, sound, and props to aid in comprehension.
Make a Model Caldera
Source Institutions
In this quick activity (page 2 of PDF under GPS: Lava Flow Activity), learners will model how large depressions near the top of a volcano are formed by using an inflating and deflating balloon submerg
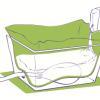
Crunch Time
Source Institutions
In this quick and easy activity and/or demonstration, learners use two empty 2-liter bottles and hot tap water to illustrate the effect of heat on pressure.
Sea State: Forecast Conditions at Sea
Source Institutions
In this oceanography and data collection activity, learners cast real time sea state conditions using buoys from NOAA's National Data Buoy Center.
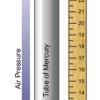
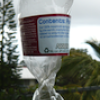
Measure the Pressure: The "Wet" Barometer
Source Institutions
In this activity, learners use simple items to construct a device for indicating air pressure changes.
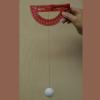
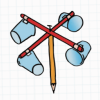
Measuring Wind Speed
Source Institutions
In this indoor and/or outdoor activity, learners make an anemometer (an instrument to measure wind speed) out of a protractor, a ping pong ball and a length of thread or fishing line.
Hexagon Hunt
Source Institutions
This activity gets learners looking at 6-sided shapes in nature, including the cells of a beehive, as well as other shapes.