Source Institutions
Source Institutions
Add to list Go to activity
Activity link broken? See if it's at the internet archive

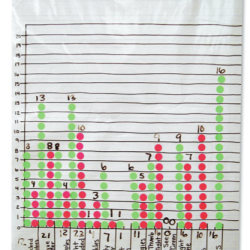
In this genetics meets math activity, learners take inventories of their own easily-observable genetic traits and compare those inventories with other learners in groups. Then, learners make data tables and bar graphs showing the most and least common traits in their group. This guide features activity sheets in English and Spanish.
- 10 to 30 minutes
- 30 to 45 minutes
- 1 cent - $1 per group of students
- Ages 8 - 14
- Activity, Lesson/Lesson Plan
- English, Spanish
Quick Guide
Subjects
-
Life Sciences
-
Heredity and Genetics
- Patterns of Heredity
- Human Genetics
- Human Body
-
Heredity and Genetics
-
Mathematics
-
Data Analysis and Probability
- Data Analysis
- Data Collection
- Data Representation
-
Measurement
- Rate
-
Data Analysis and Probability
-
The Nature of Science
-
The Scientific Process
- Conducting Investigations
- Gathering Data
- Formulating Explanations
- Communicating Results
-
The Scientific Process
Audience
To use this activity, learners need to:
- see
- see color
- read
- touch
Learning styles supported:
- Involves teamwork and communication skills
- Involves hands-on or lab activities
Other
Components that are part of this resource:
Includes alignment to state and/or national standards:
This resource is part of:
Access Rights:
- Free access
By:
- Malone, Molly ; Mitchell, April ; Stark, Louisa ; Starr, Harmony
Source Collection
- Teach.Genetics
Rights:
- All rights reserved, University of Utah, 2006
Funding Sources:
- Howard Hughes Medical Institute Precollege Science Education Initiative for Biomedical Research Institutions Award, 51000125
- Health Resources and Services Administration, Maternal and Child Health Bureau, Genetic Services Branch and the March of Dimes, U33MC00157
