Source Institutions
Source Institutions
Add to list Go to activity
Activity link broken? See if it's at the internet archive

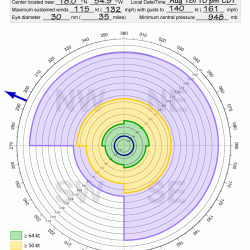
In this activity, learners discover how the extent of various wind speeds changes in each of the four quadrants around a hurricane. Learners use data from the 'present' location of Hurricane Bill (2009) to plot the distance of various wind speeds that extend from the center of the storm. This resource includes brief background information about hurricanes and forecasting as well as an explanation of the Hurricane Bill data used in this activity and how small increases in wind speed can cause increased potential for damage.
- 10 to 30 minutes
- free per student
- Ages 11 - 18
- Activity, Lesson/Lesson Plan
- English
Quick Guide
Materials List (per student)
- Four coloring pencils of different colors
- Hurricane Bill Forecast/Advisory
- 0-170 nm chart
- Time Conversion chart
- 0-100 nm chart
- 0-250 nm chart
Subjects
-
Earth and Space Science
-
Earth Processes
- Weather and Climate
-
Earth Structure
- Atmosphere
-
Earth Processes
-
Mathematics
-
Data Analysis and Probability
- Data Analysis
- Data Representation
-
Measurement
- Circles
- Number and Operations
- Representation
-
Data Analysis and Probability
-
Physical Sciences
-
Motion and Forces
- Momentum and Velocity
-
Motion and Forces
-
The Nature of Science
-
The Scientific Process
- Conducting Investigations
- Gathering Data
-
The Scientific Process
Informal Categories
- Nature and Environment
Audience
To use this activity, learners need to:
- see
- see color
- read
- touch
Learning styles supported:
- Involves hands-on or lab activities
Other
Components that are part of this resource:
This resource is part of:
Access Rights:
- Free access
By:
Rights:
- All rights reserved, National Weather Service,
