Search Results
Showing results 1 to 11 of 11

Quadraphonic Wind
Source Institutions
In this activity, learners discover how the extent of various wind speeds changes in each of the four quadrants around a hurricane.
Sea State: Forecast Conditions at Sea
Source Institutions
In this oceanography and data collection activity, learners cast real time sea state conditions using buoys from NOAA's National Data Buoy Center.

Measuring the Wind
Source Institutions
In this activity, learners explore how anemometers work to record wind speeds and how the equipment has undergone engineering adaptations over time.

Seas in Motion
Source Institutions
In this outdoor, beach activity, learners use tennis balls, water balloons and other simple devices to investigate the movement of waves and currents off a sandy beach.

Launch Altitude Tracker
Source Institutions
In this activity, learners construct hand-held altitude trackers. The device is a sighting tube with a marked water level that permits measurement of the inclination of the tube.

Rocket Wind Tunnel
Source Institutions
In this activity, learners evaluate the potential performance of air rockets placed inside a wind tunnel.
The Return of El Nino
Source Institutions
In this activity related to climate change and data analysis, learners examine temperature and precipitation data to determine if climate variations are due to El Niño.

Measure the Pressure II: The "Dry" Barometer
Source Institutions
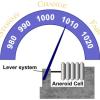
In this activity, learners use simple items to construct a device for indicating air pressure changes.

Terrestrial Hi-Lo Hunt
Source Institutions
In this outdoor activity, learners search for the warmest and coolest, windiest and calmest, wettest and driest, and brightest and darkest spots in an area.

Drawing Conclusions
Source Institutions
In this weather forecasting activity, learners determine the location of cold and warm fronts on weather plot maps.

Ships Ahoy!
Source Institutions
The goal of this activity is to design the fastest sailboat or one that carries the most treasure.
