Search Results
Showing results 21 to 40 of 61
A Pressing Engagement
Source Institutions
In this quick and easy activity and/or demonstration, learners illustrate the effect of the weight of air over our heads.
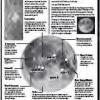
Observing the Moon
Source Institutions
Use this Moon Map Guide to help learners identify features on the Moon, while looking through a telescope.
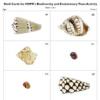
Biodiversity and Evolutionary Trees
Source Institutions
In this interactive activity, learners analyze seashells to explore phylogeny and evolution. Learners identify similar and dissimilar seashells to create a phylogenetic tree.
The Parachuting Egg
Source Institutions
In this activity, learners work in groups to design a parachute out of household items that keeps an egg secure when dropped from a certain height.
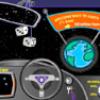
Zoom: Travel to a Star and Back to Earth
Source Institutions
This is an online activity about what would happen if we could travel at or near the speed of light.
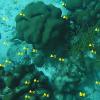
Coral Snapshots: Biodiversity in Marine Protected Areas
Source Institutions
In this data activity, learners analyze data from coral reef snapshots taken by scientists at the Virginia Institute of Marine Science.
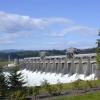
The Best Dam Simulation Ever
Source Institutions
This online simulation game explores the different consequences of water levels on the Columbia River in the Pacific Northwest.
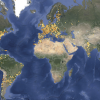
Globe at Night
Source Institutions
In this international citizen science activity, learners measure their night sky brightness and submit their observations into an online database.
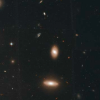
Coma Cluster of Galaxies
Source Institutions
In this activity, learners will first learn the basics of galaxy classification and grouping.
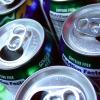
Go with the Flow
Source Institutions
In this quick and easy activity and/or demonstration, learners use two empty soda cans to illustrate Bernoulli's principle.
Fish Eyes: More than Meets the Eye
Source Institutions
In this data collection and analysis activity, learners evaluate fish physiology and ecology using vision research data from Dr.
Haunted by Hurricanes: Use Data to Learn About Hurricanes
Source Institutions
In this activity, learners will determine if the frequency and intensity of hurricanes are changing using real data from the National Hurricane Center.
The Return of El Nino
Source Institutions
In this activity related to climate change and data analysis, learners examine temperature and precipitation data to determine if climate variations are due to El Niño.
The Carbon Cycle: How It Works
Source Institutions
In this game, learners walk through an imaginary Carbon Cycle and explore the ways in which carbon is stored in reservoirs and the processes that transport the carbon atom from one location to another
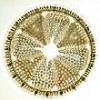
Diatom Ooze: Ooze Clues
Source Institutions
In this activity, learners will plot the distribution of various oozes using information from sediment maps.
Conductivity: Salty Water
Source Institutions
Water, whether fresh or salty, serves as one of the best electrical conductors on the planet. Does salt effect its conductivity?
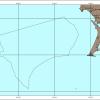
West Coast Shipwrecks
Source Institutions
In this data activity, learners will explore shipwrecks from four National Marine Sanctuaries on the West Coast of the United States.
The Ins and Outs of Tides: Learn About Causes and Predictions
Source Institutions
In this activity, learners will compare predicted and observed tides using data from The National Oceanic and Atmospheric Administration(NOAA).
Tsunami: Waves of Destruction
Source Institutions
In this activity, learners use tsunami time travel maps to predict how long it will take a tsunami to reach the shore.
Evolution in Action: Isolation and Speciation in the Lower Congo River
Source Institutions
In this guided discussion activity, learners watch a video about Central Africa's Lower Congo River, one of the most biologically diverse rivers in the world.