Search Results
Showing results 21 to 40 of 180
Arctic Sea Ice
Source Institutions
In this activity, learners explore how the area of Arctic sea ice has changed over recent years. First, learners graph the area of Arctic sea ice over time from 1979 to 2007.
Let's Count Humpback Whales: Environmental Effects on Population
Source Institutions
In this activity, learners use whale count data from the Hawaiian Islands Humpback Whale National Marine Sanctuary to compare whale counts in relation to environmental factors.
Coastal Erosion: Where's the Beach?
Source Institutions
Learners use beach profile data from a local beach or online data from Ocean City, Maryland to investigate coastal erosion and sediment transport.
How Big is Small
Source Institutions
In this classic hands-on activity, learners estimate the length of a molecule by floating a fatty acid (oleic acid) on water.
Does Sunscreen Protect My DNA?
Source Institutions
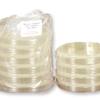
In this laboratory experiment, learners explore how effectively different sunscreens protect yeast cells from damage caused by ultraviolet (UV) radiation.
Rock Pioneers
Source Institutions
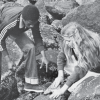
In this outdoor activity/field trip, learners investigate organisms that live along the ocean's rocky coast.
Exploring Strange New Worlds
Source Institutions
This fun and simple hands-on astronomy activity lets learners explore model planets (that they or an educator will create), using methods NASA scientists use to explore our Solar System.
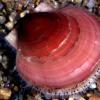
The Scoop on Scallops
Source Institutions
In this data analysis activity, learners quantify the abundance and distribution of sea scallops in and adjacent to the Mid-Atlantic closed areas.
Catch & Release II: It's Catching On!
Source Institutions
Throw that fish back? A new generation of ethical anglers concerned about conserving resources is participating in "catch and release" fishing. How is this going?
Sea State: Forecast Conditions at Sea
Source Institutions
In this oceanography and data collection activity, learners cast real time sea state conditions using buoys from NOAA's National Data Buoy Center.

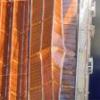
Percentage of Oxygen in the Air
Source Institutions
In this activity, learners calculate the percentage of oxygen in the atmosphere by using steel wool's ability to rust.
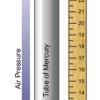
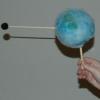
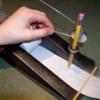
Measure the Pressure: The "Wet" Barometer
Source Institutions
In this activity, learners use simple items to construct a device for indicating air pressure changes.
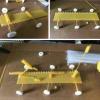
DIY Pasta Rover
Source Institutions
In this activity, learners design and build a NASA rover using raw pasta and candy with a limited imaginary budget.
Pósteres Sobre el Espacio y Matemáticas
Source Institutions
Exponga estos pósteres en el salón o déjelos donde los chicos los puedan explorar. Los chicos buscan las respuestas en línea, en libros de consulta, y en calendarios y almanaques.
Shake it up with Seismographs!
Source Institutions
In this activity, learners explore the engineering behind seismographs and how technology has improved accurate recording of earthquakes.
Folding Matters
Source Institutions
In this activity, learners explore how the process of folding has impacts on engineering and is evident in nature.
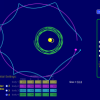
My Solar System
Source Institutions
In this online activity, learners build their own system of heavenly bodies and watch the gravitational ballet.
Super Gelatin
Source Institutions
Can gelatin (like Jell-O ®) change the speed of light?
A Scientific Cleanup
Source Institutions
This is a comprehensive lesson plan on page 85 for a group cleanup trip to a local beach, lake or stream. Learners keep track of the types and amounts of trash picked up and analyze this information.
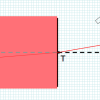
Light on Other Planets
Source Institutions
In this math-based activity, learners model the intensity of light at various distances from a light source, and understand how astronomers measure the amount of sunlight that hits our planet and othe