Search Results
Showing results 41 to 60 of 282
Arctic Sea Ice
Source Institutions
In this activity, learners explore how the area of Arctic sea ice has changed over recent years. First, learners graph the area of Arctic sea ice over time from 1979 to 2007.
It's a Gas, Man
Source Institutions
In this activity, learners discover if carbon dioxide has an effect on temperature.
Let's Count Humpback Whales: Environmental Effects on Population
Source Institutions
In this activity, learners use whale count data from the Hawaiian Islands Humpback Whale National Marine Sanctuary to compare whale counts in relation to environmental factors.
Coastal Erosion: Where's the Beach?
Source Institutions
Learners use beach profile data from a local beach or online data from Ocean City, Maryland to investigate coastal erosion and sediment transport.
Twirling in the Breeze
Source Institutions
In this engineering activity, learners build a device (an anemometer) to measure how fast the wind is blowing.
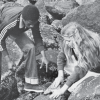
Rock Pioneers
Source Institutions
In this outdoor activity/field trip, learners investigate organisms that live along the ocean's rocky coast.
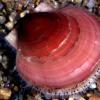
The Scoop on Scallops
Source Institutions
In this data analysis activity, learners quantify the abundance and distribution of sea scallops in and adjacent to the Mid-Atlantic closed areas.
Catch & Release II: It's Catching On!
Source Institutions
Throw that fish back? A new generation of ethical anglers concerned about conserving resources is participating in "catch and release" fishing. How is this going?
Sea State: Forecast Conditions at Sea
Source Institutions
In this oceanography and data collection activity, learners cast real time sea state conditions using buoys from NOAA's National Data Buoy Center.

Percentage of Oxygen in the Air
Source Institutions
In this activity, learners calculate the percentage of oxygen in the atmosphere by using steel wool's ability to rust.
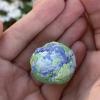
Seed Orbs
Source Institutions
In this activity, learners will make seed orbs to grow new trees and plants. Learners will explore ecology and life cycles as well as stewardship through this activity.
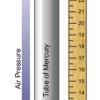
Measure the Pressure: The "Wet" Barometer
Source Institutions
In this activity, learners use simple items to construct a device for indicating air pressure changes.
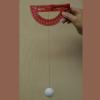
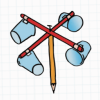
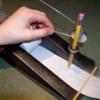
Measuring Wind Speed
Source Institutions
In this indoor and/or outdoor activity, learners make an anemometer (an instrument to measure wind speed) out of a protractor, a ping pong ball and a length of thread or fishing line.
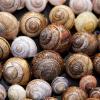
Hexagon Hunt
Source Institutions
This activity gets learners looking at 6-sided shapes in nature, including the cells of a beehive, as well as other shapes.
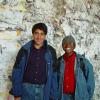
Mapping Mockingbirds
Source Institutions
This lesson plan revolves around studying the speciation of the Galápagos mockingbirds, which are on display at the California Academy of Sciences.
Shake it up with Seismographs!
Source Institutions
In this activity, learners explore the engineering behind seismographs and how technology has improved accurate recording of earthquakes.
Measuring Biodiversity
Source Institutions
Learners use a variety of beans to represent a variety of species, and scatter these beans over a large piece of paper representing the environment.
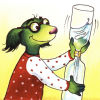
Recycle Your Own Paper!
Source Institutions
In this activity (page 2 of PDF under GPS: Garbology Activity), learners will prepare sheets of homemade recycled paper from several different source pulps.
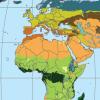
Discovering Rainforest Locations
Source Institutions
In this activity, learners will examine various world data maps to combine the information and predict which areas could be tropical rainforests.
Twist and Spout
Source Institutions
In this activity, learners make their own "tornado" using two soda bottles and water.