Search Results
Showing results 1 to 20 of 59
A Funny Taste
Source Institutions
In this activity, learners explore the different salinities of various sources of water by taste-testing.
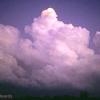
How Much Water is in that Cloud?
Source Institutions
In this activity, learners working in pairs saturate a cotton ball using water drops from an eyedropper to demonstrate the high water capacity of clouds.
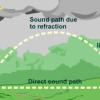
The Rumblin' Road: Determining distance to a Thunderstorm
Source Institutions
In this activity, learners discover how to determine the distance to a lightning strike or nearby thunderstorm.
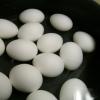
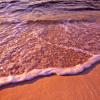
Salt 'n Lighter
Source Institutions
In this activity, learners discover that as the salinity of water increases, the density increases as well. Learners prove this by attempting to float fresh eggs in saltwater and freshwater.
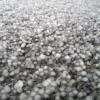
Sizing Up Hail
Source Institutions
In this activity, learners will estimate the sizes of balls to learn how to estimate the size of hail. Learners will compare their estimates to the estimates of their peers and the real measurements.
Quadraphonic Wind
Source Institutions
In this activity, learners discover how the extent of various wind speeds changes in each of the four quadrants around a hurricane.
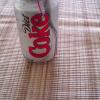
Diet Light
Source Institutions
In this quick activity, learners observe how the added sugar in a can of soda affects its density and thus, its ability to float in water.
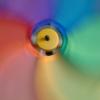
Earth's Energy Cycle: Albedo
Source Institutions
In this activity, learners experiment and observe how the color of materials that cover the Earth affects the amounts of sunlight our planet absorbs.
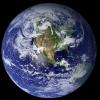
Arctic Sea Ice
Source Institutions
In this activity, learners explore how the area of Arctic sea ice has changed over recent years. First, learners graph the area of Arctic sea ice over time from 1979 to 2007.
It's a Gas, Man
Source Institutions
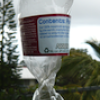
In this activity, learners discover if carbon dioxide has an effect on temperature.
The Carbon Cycle and its Role in Climate Change: Activity 3
Source Institutions
In this activity, learners explore the human influences on the carbon cycle and examine how fossil fuels release carbon.
Coral, Carbon Dioxide and Calcification
Source Institutions
In this group activity, learners act out key stages of the "ocean carbon cycle" (also known as the "carbonate buffer system") through motions, rearranging blocks and team tasks.
Crunch Time
Source Institutions
In this quick and easy activity and/or demonstration, learners use two empty 2-liter bottles and hot tap water to illustrate the effect of heat on pressure.
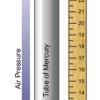
Measure the Pressure: The "Wet" Barometer
Source Institutions
In this activity, learners use simple items to construct a device for indicating air pressure changes.
Cloud Fun
Source Institutions
Learners complete a series of hands-on and investigative activities to explore cumulus clouds.
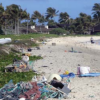
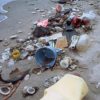
A Scientific Cleanup
Source Institutions
This is a comprehensive lesson plan on page 85 for a group cleanup trip to a local beach, lake or stream. Learners keep track of the types and amounts of trash picked up and analyze this information.
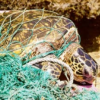
All Tangled Up
Source Institutions
In this activity on page 60, learners examine and simulate wildlife entanglement by experiencing what it might be like to be a marine animal trapped in debris.
Trash Traits
Source Institutions
In this activity on page 24, learners perform experiments to examine whether or not trash can float, blow around, or wash away.
Toasty Wind
Source Institutions
In this quick activity, learners use a toaster to investigate the source for the Earth's wind. Learners hold a pinwheel above a toaster to discover that rising heat causes wind.
The Shadow Knows II
Source Institutions
In this activity, learners will measure the length of a shadow and use the distance from the equator to calculate the circumference of the earth.