Search Results
Showing results 1 to 10 of 10
The Rumblin' Road: Determining distance to a Thunderstorm
Source Institutions
In this activity, learners discover how to determine the distance to a lightning strike or nearby thunderstorm.
Quadraphonic Wind
Source Institutions
In this activity, learners discover how the extent of various wind speeds changes in each of the four quadrants around a hurricane.

Head in the Clouds
Source Institutions
In this activity, learners create a CloudSpotter wheel and record the different types of clouds they observe twice daily over several days.
Updrafts in Action
Source Institutions
In this weather activity/demonstration, learners watch as a ping pong ball is suspended in a stream of air supplied by a hair dryer.
Drawing Conclusions
Source Institutions
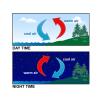
In this weather forecasting activity, learners determine the location of cold and warm fronts on weather plot maps.
The Return of El Nino
Source Institutions
In this activity related to climate change and data analysis, learners examine temperature and precipitation data to determine if climate variations are due to El Niño.
The Daily Ups and Downs
Source Institutions
In this activity, learners graph 48 hourly air temperatures from a local weather observation site and observe the diurnal temperature variations.
Turning the Air Upside Down: Spinning Snakes
Learners color and cut out a spiral-shaped snake. When they hang their snake over a radiator, the snake spins.
Forward Thinking
Source Institutions
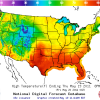
In this activity, learners create their own weather forecast map.
AM in the PM
Source Institutions
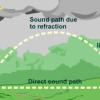
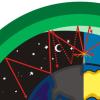
In this activity, learners will listen to as many radio stations as possible to discover that AM radio signals can travel many hundreds of miles at night.