Search Results
Showing results 1 to 20 of 24
Dripping Wet or Dry as a Bone?
Learners investigate the concept of humidity by using a dry and wet sponge as a model. They determine a model for 100% humidity, a sponge saturated with water.
How Much Water is in that Cloud?
Source Institutions
In this activity, learners working in pairs saturate a cotton ball using water drops from an eyedropper to demonstrate the high water capacity of clouds.
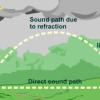
The Rumblin' Road: Determining distance to a Thunderstorm
Source Institutions
In this activity, learners discover how to determine the distance to a lightning strike or nearby thunderstorm.
Quadraphonic Wind
Source Institutions
In this activity, learners discover how the extent of various wind speeds changes in each of the four quadrants around a hurricane.
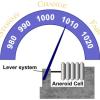
Good News: We're on the Rise!
Learners build a simple aneroid barometer to learn about changes in barometric pressure and weather forecasting. They observe their barometer and record data over a period of days.
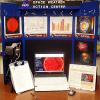
Space Weather Action Center
Source Institutions
In this interdisciplinary activity, learners create a Space Weather Action Center (SWAC) to monitor solar storms and develop real SWAC news reports.
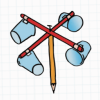
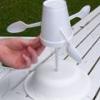
Twirling in the Breeze
Source Institutions
In this engineering activity, learners build a device (an anemometer) to measure how fast the wind is blowing.
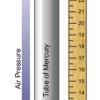
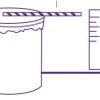
Measure the Pressure: The "Wet" Barometer
Source Institutions
In this activity, learners use simple items to construct a device for indicating air pressure changes.
Let's Dew It!
Source Institutions
From the Weather Watchers featured theme on the CYBERCHASE website. Learners will conduct experiments to discover how air temperature and humidity work together to make condensation, dew, and fog.
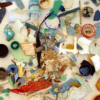
A Degrading Experience
Source Institutions
In this activity on page 27, learners perform an experiment to learn about how different types of marine debris degrade and how weather and sunlight affect the rate of degradation.
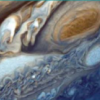
Weather Stations: Storms
Source Institutions
In this activity, learners test how cornstarch and glitter in water move when disturbed. Learners compare their observations with videos of Jupiter's and Earth's storm movements.

Making Sense of Sensors
Source Institutions
In this activity, learners explore sensors and focus specifically on how to measure humidity using a sensor.
Measuring the Wind
Source Institutions
In this activity, learners explore how anemometers work to record wind speeds and how the equipment has undergone engineering adaptations over time.
The Daily Ups and Downs
Source Institutions
In this activity, learners graph 48 hourly air temperatures from a local weather observation site and observe the diurnal temperature variations.
The Return of El Nino
Source Institutions
In this activity related to climate change and data analysis, learners examine temperature and precipitation data to determine if climate variations are due to El Niño.
It's the "Rain," Man
Source Institutions
In this weather forecasting activity, learners use common materials to construct a rain gauge and measure daily, monthly, and yearly rainfall.
Measure the Pressure II: The "Dry" Barometer
Source Institutions
In this activity, learners use simple items to construct a device for indicating air pressure changes.
Weather Forecasting
Source Institutions
This activity (on page 2 of the PDF under SciGirls Activity: Forecasting) is a full inquiry investigation into meteorology and forecasting.
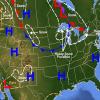
Drawing Conclusions
Source Institutions
In this weather forecasting activity, learners determine the location of cold and warm fronts on weather plot maps.
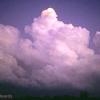
Head in the Clouds
Source Institutions
In this activity, learners create a CloudSpotter wheel and record the different types of clouds they observe twice daily over several days.