Search Results
Showing results 1 to 20 of 27
Blowin’ Up a Storm of Oil
Source Institutions
In this activity, learners investigate how wind can create surface currents and how waves move. Learners also discover how wind can affect oil spills.

Drying It Out
Source Institutions
In this activity, learners investigate and compare the rate of drying in different conditions.
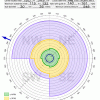
Quadraphonic Wind
Source Institutions
In this activity, learners discover how the extent of various wind speeds changes in each of the four quadrants around a hurricane.
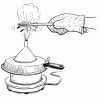
Going for a Spin: Making a Model Steam Turbine
Source Institutions
In this activity, learners explore how various energy sources can be used to cause a turbine to rotate.
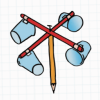
Twirling in the Breeze
Source Institutions
In this engineering activity, learners build a device (an anemometer) to measure how fast the wind is blowing.
Sea State: Forecast Conditions at Sea
Source Institutions
In this oceanography and data collection activity, learners cast real time sea state conditions using buoys from NOAA's National Data Buoy Center.
Kites
Source Institutions
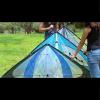
This activity (on page 2 of the PDF under SciGirls Activity: Kites) is a full inquiry investigation into how a kite’s shape affects its performance.
Getting Windy
Source Institutions
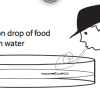
In this activity, learners create and understand surface currents. Learners create example surface currents and discover how landmasses affect the current.

Erosion
Source Institutions
In this activity, learners model erosion using a clear shoebox and sand or soil.
What Causes Wind?
Source Institutions
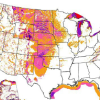
In this sunny day experiment, learners measure and compare how quickly light and dark colored materials absorb heat.
Measuring the Wind
Source Institutions
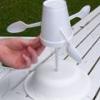
In this activity, learners explore how anemometers work to record wind speeds and how the equipment has undergone engineering adaptations over time.

Seas in Motion
Source Institutions
In this outdoor, beach activity, learners use tennis balls, water balloons and other simple devices to investigate the movement of waves and currents off a sandy beach.
Wonderful Weather
Source Institutions
In this activity, learners conduct three experiments to examine temperature, the different stages of the water cycle, and how convection creates wind.
Mini Glacier Meltdown
Source Institutions
This activity (located on page 3 of the PDF under GPS: Glaciers Activity) is a full inquiry investigation about the different causes of glacial melt.
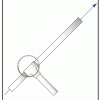
Launch Altitude Tracker
Source Institutions
In this activity, learners construct hand-held altitude trackers. The device is a sighting tube with a marked water level that permits measurement of the inclination of the tube.

Rocket Wind Tunnel
Source Institutions
In this activity, learners evaluate the potential performance of air rockets placed inside a wind tunnel.
The Return of El Nino
Source Institutions
In this activity related to climate change and data analysis, learners examine temperature and precipitation data to determine if climate variations are due to El Niño.
OBIS Oil Spill
Source Institutions
In this outdoor activity, learners simulate an oil spill using popcorn (both oil and popcorn float on water), and estimate the spill's impact on the environment.
Catch a Wave: How Waves are Formed
Source Institutions
In this three-part activity, learners explore how waves are formed and why some waves are bigger than others. First, learners observe waves of water in a pan generated by an electric fan.
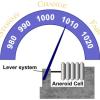
Measure the Pressure II: The "Dry" Barometer
Source Institutions
In this activity, learners use simple items to construct a device for indicating air pressure changes.
